
A startup I know launched their MVP on a Friday afternoon. The founder posted on LinkedIn. A tech journalist picked it up. By Monday morning, they had 40,000 concurrent users — and a completely dead application. The database was pegged at 100% CPU. The single application server had run out of memory. Errors were cascading everywhere. The team was reading exception emails faster than they could triage them, with no monitoring to tell them which issue was the actual root cause.
The code was fine. The product worked. The architecture was simply never designed to handle the moment it succeeded.
This is the story of almost every web application that gets built without understanding what production actually requires. We learn to code. We learn frameworks. We deploy to a VPS and call it done. Then traffic hits, or a dependency fails, or a background job takes four minutes and blocks everything else, and we discover that "it works on my machine" and "it survives contact with reality" are two very different engineering achievements.
This post is the blueprint that startup needed before that Friday. We're going to walk through every layer of a production-ready web application — CI/CD, load balancers, CDNs, databases, caches, job workers, search, and monitoring — in the order a user's request actually encounters them. Every section includes real tools, real configuration, and the nuance that most architecture overviews leave out. By the end, you'll see the complete picture — not just individual components, but how they work together as a resilient system.
Table of Contents
- CI/CD Pipelines: Ship Code Without Breaking Things
- Load Balancers and Reverse Proxies: Traffic Direction at Scale
- Content Delivery Networks: Speed as a Feature
- API and Backend Services: The Engine Room
- Databases and Caching: Where Your Data Lives and How to Access It Fast
- Job Workers: Keeping Your App Responsive Under Load
- Search Functionality: Finding Needles in Haystacks
- Monitoring and Alerting: The Eyes and Ears of Production
- How It All Connects: Following a Request Through the Stack
- Getting Started: Building Your Production Stack Step by Step
- FAQ
- Conclusion
CI/CD Pipelines: Ship Code Without Breaking Things
Imagine you're a surgeon. Before every operation, there's a checklist: equipment verified, patient vitals checked, allergies confirmed, team briefed. You don't skip the checklist because you're in a hurry — you follow it because the checklist is what makes speed safe. A CI/CD pipeline is your deployment checklist, automated so thoroughly that it runs itself before any human can forget to.
CI/CD stands for Continuous Integration and Continuous Delivery (or Deployment). The CI part — Continuous Integration — means every code change is automatically built and tested the moment it's pushed. No more "it worked on my branch." Every pull request runs the full test suite, linting, security scanning, and build verification before anyone reviews a single line. The CD part means that once code is merged and CI passes, the deployment to staging (or even production) is automated, reproducible, and logged. No more "I deployed it manually and forgot to document the environment variable I changed."
Tools like GitHub Actions, GitLab CI, and CircleCI orchestrate these pipelines as code — YAML files living in your repository that define every step of the automation. The pipeline isn't a separate system someone manages; it's version-controlled alongside your application. When your pipeline breaks, the fix is a code change like any other. This self-documenting quality is one of CI/CD's most underappreciated benefits: new engineers can read exactly how your deployment works without asking anyone.
Here's the thing most tutorials miss about CI/CD: the pipeline is not just about preventing bugs — it's about speed. A well-built CI/CD pipeline means the gap between "code merged" and "code in production" is minutes, not days. That speed enables smaller, safer deployments. Small deployments mean smaller blast radius when something goes wrong. Smaller blast radius means faster recovery. The entire model is a virtuous cycle where automation enables both speed and safety simultaneously — not as a tradeoff.
# .github/workflows/deploy.yml — GitHub Actions CI/CD pipeline
name: CI/CD Pipeline

on:
  push:
    branches: [main]
  pull_request:
    branches: [main]

jobs:
  test:
    runs-on: ubuntu-latest
    services:
      postgres:
        image: postgres:15
        env:
          POSTGRES_PASSWORD: testpassword
        options: >-
          --health-cmd pg_isready
          --health-interval 10s
          --health-timeout 5s
          --health-retries 5

    steps:
      - uses: actions/checkout@v4

      - name: Set up Node.js
        uses: actions/setup-node@v4
        with:
          node-version: '20'
          cache: 'npm'

      - name: Install dependencies
        run: npm ci

      - name: Run linting
        run: npm run lint

      - name: Run tests
        run: npm run test:ci
        env:
          DATABASE_URL: postgres://postgres:testpassword@localhost:5432/testdb

      - name: Build application
        run: npm run build

      - name: Security audit
        run: npm audit --audit-level=high

  deploy:
    needs: test           # only runs if tests pass
    runs-on: ubuntu-latest
    if: github.ref == 'refs/heads/main'   # only on main branch

    steps:
      - uses: actions/checkout@v4

      - name: Deploy to production
        run: |
          # Example: deploy via SSH to your server, or via cloud CLI
          echo "Deploying to production..."
          # kubectl apply -f k8s/ (Kubernetes)
          # aws ecs update-service ... (ECS)
          # fly deploy (Fly.io)
Pro Tips & Common Mistakes — CI/CD
Pro Tip: Cache your dependencies aggressively in CI. Installing
node_modulesor Python packages from scratch on every pipeline run wastes 1–3 minutes per run. GitHub Actions'cacheaction, GitLab'scachedirective, and equivalent features in all major CI tools can cut your pipeline time by 50–70%. Over a team of 10 developers merging 5 times a day, that's hours of compute time saved weekly.
Common Mistake: Only running tests in CI and skipping them locally. Your CI pipeline should be fast enough that developers don't bypass it — but tests should also run locally before pushing. Install a pre-commit hook with
husky(Node.js) orpre-commit(Python) to run linting and fast unit tests on every commit. Catch errors before they ever reach CI, where the feedback cycle is longer.
Load Balancers and Reverse Proxies: Traffic Direction at Scale
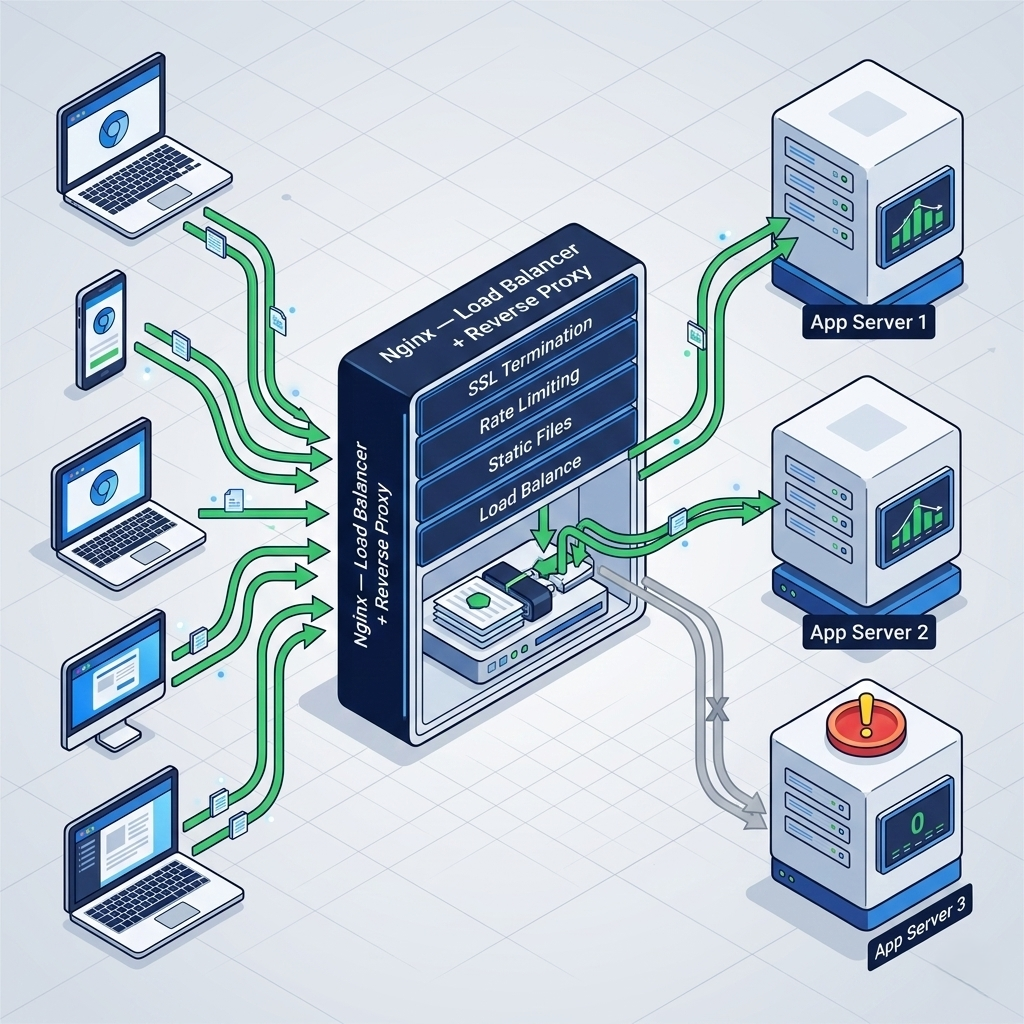
Your application server is a single point of failure. Every production system that matters has more than one of them — and something in front of them deciding which one handles each incoming request. That something is a load balancer.
Picture a busy airport check-in hall. There are twenty counters open and hundreds of passengers arriving. Without coordination, some counters have queues 40 people deep while others sit idle. A load balancer is the airline employee at the entrance who scans the hall and directs each passenger to the shortest queue. The passenger doesn't choose their counter; the coordinator routes them to the best available option. And when one counter agent goes home sick, the coordinator just stops sending passengers there — no one notices from the passenger's perspective.
Nginx and HAProxy are the workhorses of load balancing at the infrastructure level. Cloud providers offer managed options (AWS ALB/NLB, GCP Cloud Load Balancing, Cloudflare Load Balancing) that handle the operational overhead but come with less flexibility. All of them support the core load balancing algorithms you need to understand: round-robin (requests distributed evenly in turn), least-connections (requests sent to the server with fewest active connections, better for varying request durations), and IP hash (requests from the same IP always go to the same server, useful for session affinity).
The reverse proxy function is closely related but distinct. A reverse proxy sits in front of your application servers and handles everything that shouldn't be the application's job: SSL/TLS termination (decrypting HTTPS so your app only handles HTTP internally), gzip compression, connection rate limiting, request logging, and serving static files directly without ever touching your application code. Nginx is exceptional at this — a single Nginx process can handle tens of thousands of concurrent connections, serving static assets and terminating SSL while routing dynamic requests to application servers running slower, memory-hungry runtimes.
# nginx.conf — production-grade load balancer + reverse proxy configuration
upstream app_servers {
    least_conn;                          # route to server with fewest active connections
    server app1.internal:3000 weight=1;
    server app2.internal:3000 weight=1;
    server app3.internal:3000 weight=1;
    keepalive 32;                        # maintain persistent connections to upstreams
}

server {
    listen 80;
    server_name yourdomain.com;
    return 301 https://$host$request_uri;   # redirect all HTTP to HTTPS
}

server {
    listen 443 ssl http2;
    server_name yourdomain.com;

    # SSL termination — handles HTTPS so app servers don't have to
    ssl_certificate /etc/letsencrypt/live/yourdomain.com/fullchain.pem;
    ssl_certificate_key /etc/letsencrypt/live/yourdomain.com/privkey.pem;
    ssl_protocols TLSv1.2 TLSv1.3;
    ssl_ciphers ECDHE-ECDSA-AES128-GCM-SHA256:ECDHE-RSA-AES128-GCM-SHA256;

    # Serve static files directly (never touch app server)
    location /static/ {
        root /var/www;
        expires 1y;
        add_header Cache-Control "public, immutable";
    }

    # Proxy dynamic requests to application servers
    location / {
        proxy_pass http://app_servers;
        proxy_http_version 1.1;
        proxy_set_header Upgrade $http_upgrade;
        proxy_set_header Connection 'upgrade';
        proxy_set_header Host $host;
        proxy_set_header X-Real-IP $remote_addr;
        proxy_set_header X-Forwarded-For $proxy_add_x_forwarded_for;
        proxy_cache_bypass $http_upgrade;

        # Timeouts
        proxy_connect_timeout 5s;
        proxy_read_timeout 30s;

        # Rate limiting
        limit_req zone=api burst=20 nodelay;
    }
}
Pro Tips & Common Mistakes — Load Balancers
Pro Tip: Implement health check endpoints (
/healthor/ping) in your application that load balancers can poll. Return HTTP 200 only when your application is genuinely ready to serve traffic — database connected, cache connected, required services accessible. A health check that always returns 200 regardless of internal state defeats the purpose and means your load balancer will route traffic to a broken server.
Common Mistake: Ignoring sticky sessions (session affinity) when your application stores session state in memory. If users are routed to different servers on each request, their in-memory session data won't follow them. Either use a shared session store (Redis is the standard solution) so any server can serve any session, or configure IP-hash load balancing as a short-term workaround. The former is the production-correct approach.
Content Delivery Networks: Speed as a Feature
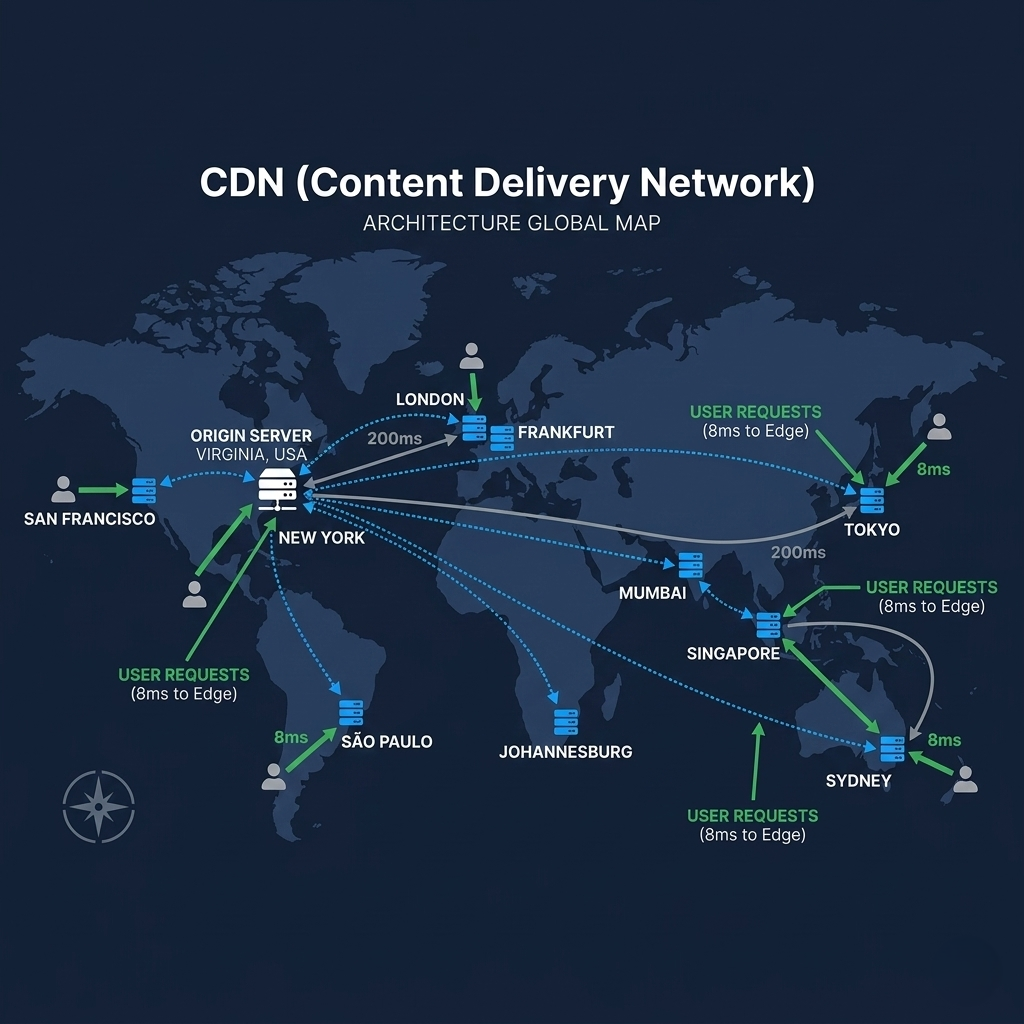
Your server lives in one data center. Your users live everywhere. When a user in São Paulo loads your page that's hosted in Virginia, every asset — every image, every CSS file, every JavaScript bundle — travels across the Atlantic and back. That's latency you can't engineer away at the application level. It's physics. The only solution is to not serve from Virginia at all.
A Content Delivery Network (CDN) is a globally distributed network of edge servers — data centers located in dozens or hundreds of cities worldwide. When your CDN caches a copy of your static assets on an edge server in São Paulo, your Brazilian users get those assets from a server that might be 10 miles away instead of 4,000. The round-trip time drops from 200ms to 8ms. That 192ms improvement per asset, multiplied across dozens of assets, is the difference between a page that feels slow and one that feels instant.
CDNs like Cloudflare, Fastly, and AWS CloudFront don't just cache static files. Modern CDNs handle DDoS protection (absorbing attack traffic before it reaches your servers), bot mitigation, edge-side rendering for dynamic content, automatic image optimization (WebP conversion, responsive resizing), and TLS certificate management. Cloudflare's free tier handles more infrastructure work than most startups' entire ops teams did manually ten years ago.
The counterintuitive insight about CDNs: they're not just for large-scale apps. A single-person SaaS product benefits just as much from CDN caching as a Fortune 500 company — arguably more, because the startup doesn't have the ops team bandwidth to optimize every asset manually. Setting up Cloudflare takes 20 minutes and immediately improves load times for every international user you have and every international user you'll ever get.
# Setting cache headers for CDN optimization in your application
# Express.js example — differentiated caching strategy

app.use('/static', express.static('public', {
  maxAge: '1y',      # Static assets: cache forever (they're content-hashed)
  immutable: true,   # Tell CDN this URL's content will never change
}));

app.use('/api', (req, res, next) => {
  res.set('Cache-Control', 'no-store');  # API responses: never cache
  next();
});

app.get('/feed', async (req, res) => {
  const data = await getFeedData();
  res.set('Cache-Control', 'public, max-age=60, stale-while-revalidate=300');
  # CDN can serve stale for 5min while fetching fresh in background
  res.json(data);
});

# Cloudflare-specific headers to control edge behavior:
# CF-Cache-Status: HIT/MISS/EXPIRED in response tells you cache state
# Cache-Tag: product-123 allows targeted cache purging by tag

# Purge specific paths via Cloudflare API when content changes:
curl -X POST "https://api.cloudflare.com/client/v4/zones/ZONE_ID/purge_cache" \
  -H "Authorization: Bearer YOUR_API_TOKEN" \
  -H "Content-Type: application/json" \
  --data '{"files":["https://yourdomain.com/static/main.css"]}'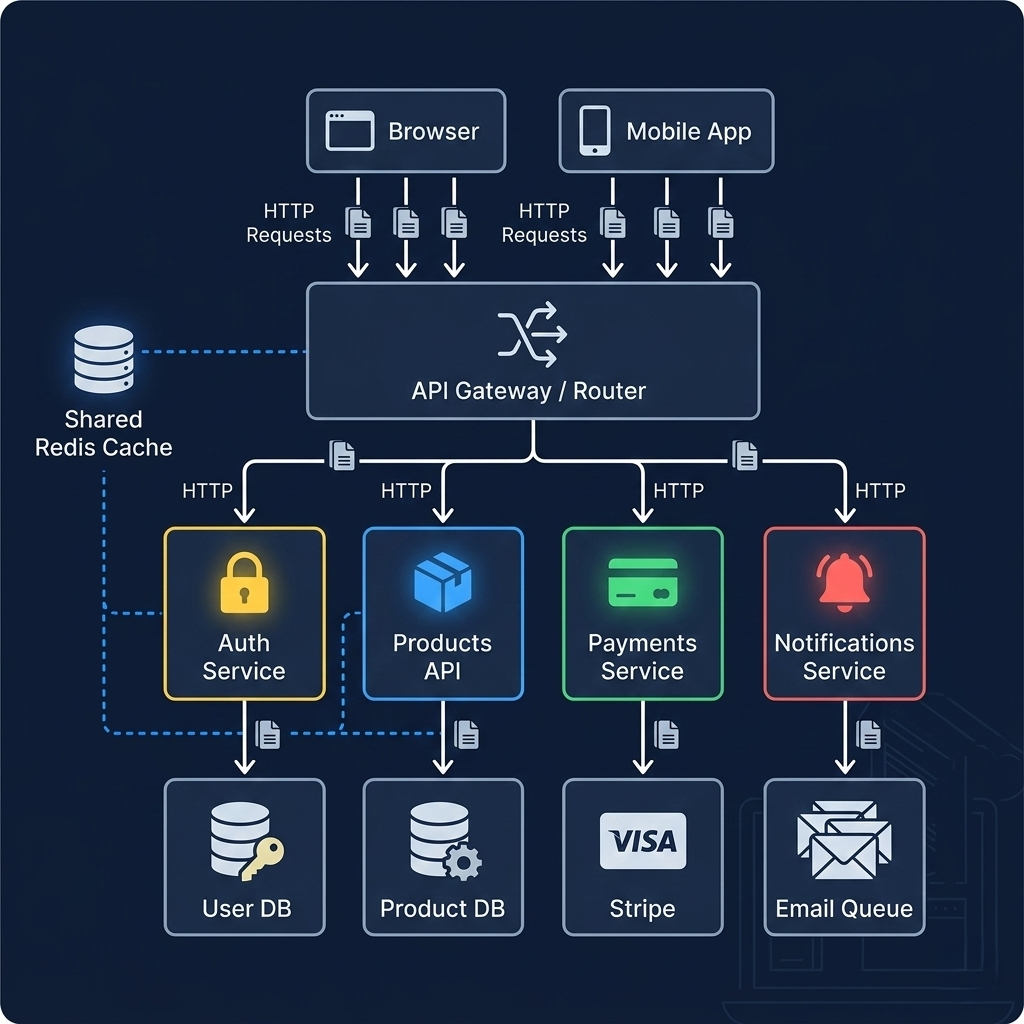
Pro Tips & Common Mistakes — CDN
Pro Tip: Use content-hashed filenames for all static assets (your build tool likely does this already:
main.a3f8c2d1.js). With a content hash in the filename, you can setCache-Control: max-age=31536000, immutable— telling CDNs and browsers to cache forever and never revalidate. When the file changes, its hash changes, its URL changes, and caches automatically pick up the new version. This approach gives you unlimited cache lifetimes without stale content problems.
Common Mistake: Caching API responses on a CDN without thinking carefully about personalization and privacy. Caching
GET /api/user/profileon a CDN edge might serve User A's profile data to User B if both requests come through the same edge node. Ensure authenticated API responses includeCache-Control: private, no-storeor use aVary: Authorizationheader. CDN misconfiguration leading to data leakage between users is a real, documented class of security incident.
API and Backend Services: The Engine Room
The load balancer has routed the request, the CDN has served every static asset. Now we're dealing with the actual application logic — the dynamic content that can't be cached, the business rules that make your product what it is. This is the domain of your API and backend services.
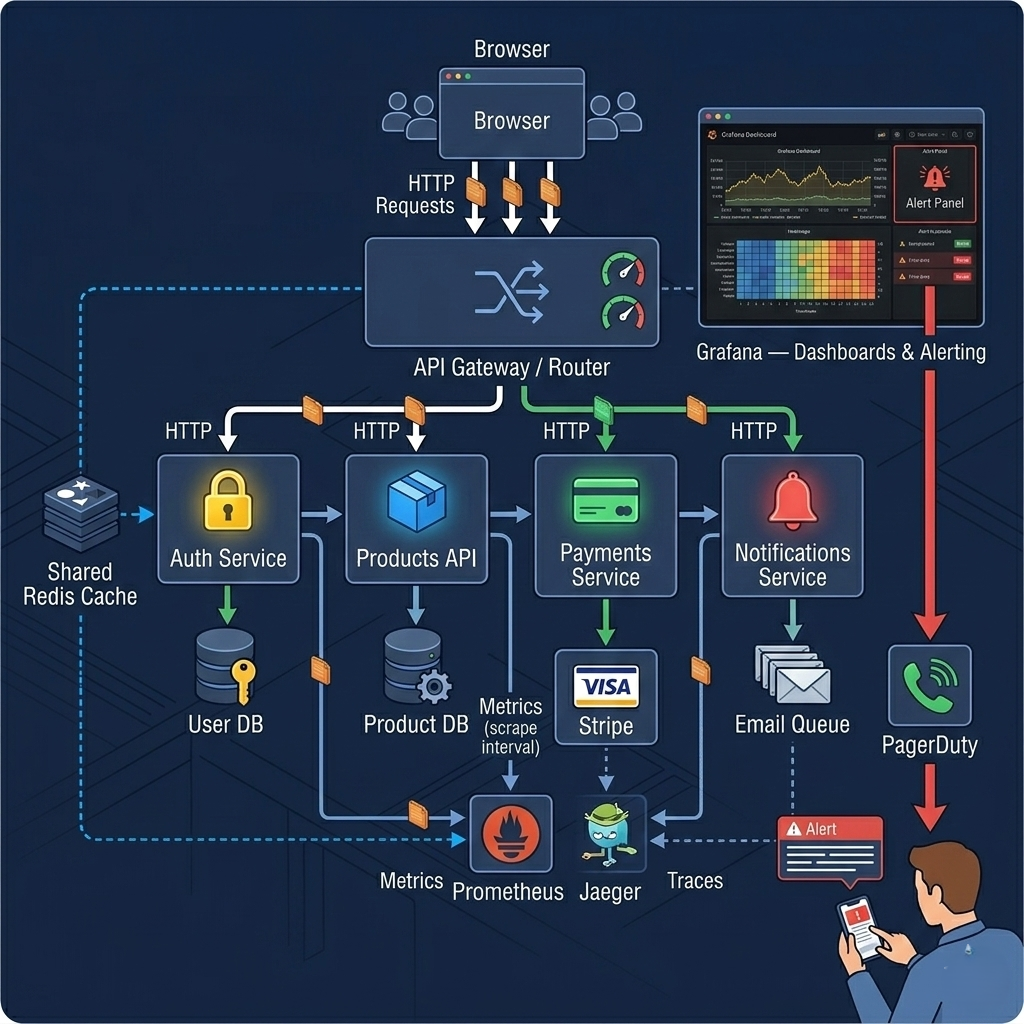
Modern backend architecture has largely converged on the idea that APIs should be modular rather than monolithic. Not necessarily microservices (the microservices movement overcorrected significantly — more on that in a moment), but well-separated concerns within your backend. An authentication service that issues tokens. A product API that handles catalog operations. A payments service that wraps your payment processor. An email service that queues and sends notifications. Each service has clear boundaries, and the frontend communicates with all of them through clean API contracts.
REST is the dominant paradigm for these APIs — stateless request/response over HTTP, with resources identified by URLs and operations expressed through HTTP verbs (GET, POST, PUT, PATCH, DELETE). GraphQL has gained traction for frontend-facing APIs because it lets clients specify exactly what data they need, eliminating over-fetching. gRPC is the preferred choice for internal service-to-service communication where performance matters and you control both ends of the connection. Choosing between them is less about which is "better" and more about understanding what problem each solves best for your specific use case.
Here's the counterintuitive thing most tutorials miss about backend architecture: start with a well-structured monolith, not microservices. The microservices architecture solves organizational scaling problems (many independent teams) and operational scaling problems (independently scaling specific services). If you have neither problem — and most teams building their first production app don't — microservices add enormous operational complexity (service discovery, distributed tracing, network latency between services, independent deployment pipelines) without the benefits. A well-organized monolith that deploys as a single artifact is dramatically easier to build, test, debug, and operate. You can always extract services later when you genuinely need to.
// Express.js API structure — modular monolith pattern
// routes/products.js
const express = require('express');
const router = express.Router();
const { authenticate } = require('../middleware/auth');
const { validateRequest } = require('../middleware/validate');
const ProductService = require('../services/ProductService');
const { createProductSchema } = require('../schemas/product');

// GET /api/products — list products with pagination (cursor-based)
router.get('/', async (req, res, next) => {
  try {
    const { cursor, limit = 20 } = req.query;
    const products = await ProductService.list({ cursor, limit: Math.min(limit, 100) });
    res.json({
      data: products.items,
      pagination: { next_cursor: products.nextCursor, has_more: products.hasMore }
    });
  } catch (err) {
    next(err);  // centralized error handling
  }
});

// POST /api/products — create product (authenticated + validated)
router.post('/',
  authenticate,                          // verify JWT token
  validateRequest(createProductSchema),  // validate request body
  async (req, res, next) => {
    try {
      const product = await ProductService.create(req.body, req.user.id);
      res.status(201).json({ data: product });
    } catch (err) {
      next(err);
    }
  }
);

module.exports = router;

// Centralized error handler — catches all next(err) calls
app.use((err, req, res, next) => {
  console.error({ err, path: req.path, method: req.method });
  const status = err.status || 500;
  res.status(status).json({
    error: { message: err.message, code: err.code || 'INTERNAL_ERROR' }
  });
});
Pro Tips & Common Mistakes — API and Backend
Pro Tip: Version your APIs from day one:
/api/v1/products,/api/v2/products. API versioning isn't just for public APIs — internal APIs change over time too, and having a versioning strategy means you can iterate without breaking existing clients. Even if you never actually create a v2, establishing the pattern early means you're not refactoring URLs at the worst possible moment.
Common Mistake: Letting your API controllers contain business logic. Controllers should receive requests, call services, and return responses — nothing more. Business logic belongs in service classes or domain objects. When business logic lives in controllers, it becomes impossible to test without simulating HTTP requests, impossible to reuse from workers or scripts, and impossible to reason about in isolation. Thin controllers, fat services.
Databases and Caching: Where Your Data Lives and How to Access It Fast
Every application has two data performance problems that pull in opposite directions. The first is durability: data must survive crashes, hardware failures, and human error. The second is speed: data must be accessible quickly enough that users don't notice they're waiting for it. Traditional relational databases like PostgreSQL solve the first problem brilliantly. Redis solves the second. Production systems use both together, and understanding why requires understanding what each is actually optimized for.
PostgreSQL (and relational databases generally) store data to disk with ACID guarantees — Atomicity, Consistency, Isolation, Durability. When you write a transaction in Postgres, you're guaranteed it either happens completely or not at all, it leaves the database in a consistent state, it doesn't interfere with concurrent transactions, and it survives a server crash. These guarantees are why relational databases have been the backbone of financial systems, healthcare records, and any domain where data correctness is non-negotiable. But they come at a cost: disk I/O is slow relative to memory, and complex queries with joins and aggregations can be expensive.
Redis addresses that cost by living entirely in memory. A Redis lookup takes microseconds — roughly 1,000 times faster than a typical PostgreSQL query. The tradeoff is that Redis is optimized for speed, not for the complex relational queries that Postgres handles beautifully. Redis excels at caching frequently-read data (user profiles, product details, API responses), storing ephemeral state (user sessions, rate limit counters, feature flags), and as the message broker for job queues. The architecture pattern that works is using Postgres as the source of truth and Redis as the performance layer in front of it.
DynamoDB is worth understanding as the primary alternative when your access patterns are simple, predictable, and your scale is genuinely large. DynamoDB is a fully-managed key-value and document store from AWS that scales horizontally without limit and charges per operation — no server sizing, no connection pooling, no performance degradation as data grows. The tradeoff is rigid access patterns: you must design your data model around your queries at schema design time. Complex joins, ad-hoc queries, and reporting are painful or impossible. For applications with clear, stable query patterns (like a gaming leaderboard or a simple user profile store), DynamoDB is exceptionally operational.
// Database + Redis caching pattern — cache-aside strategy
const { Pool } = require('pg');
const redis = require('redis');

const db = new Pool({ connectionString: process.env.DATABASE_URL });
const cache = redis.createClient({ url: process.env.REDIS_URL });

async function getUserProfile(userId) {
  const cacheKey = `user:profile:${userId}`;

  // 1. Try cache first (microseconds)
  const cached = await cache.get(cacheKey);
  if (cached) {
    return JSON.parse(cached);  // cache hit — fast path
  }

  // 2. Cache miss — query database (milliseconds)
  const result = await db.query(
    `SELECT id, name, email, avatar_url, preferences, created_at
     FROM users WHERE id = $1`,
    [userId]
  );

  if (!result.rows[0]) return null;

  const user = result.rows[0];

  // 3. Populate cache with TTL (e.g., 5 minutes)
  await cache.setEx(cacheKey, 300, JSON.stringify(user));

  return user;  // cold path — slower, but populates cache for next request
}

// Cache invalidation — when user updates their profile
async function updateUserProfile(userId, updates) {
  await db.query(
    'UPDATE users SET name=$1, preferences=$2, updated_at=NOW() WHERE id=$3',
    [updates.name, updates.preferences, userId]
  );

  // Invalidate the cache — force next read to fetch fresh data
  await cache.del(`user:profile:${userId}`);
}
Pro Tips & Common Mistakes — Databases and Caching
Pro Tip: Never cache what you can't invalidate. Before caching any data, ask: "When this data changes, will I know to invalidate the cache?" User profiles and product details are easy — invalidate on update. Aggregated data (total order counts, average ratings) is harder — changes to any of a hundred records affect the aggregate. For complex aggregations, use a short TTL and accept eventual consistency rather than trying to maintain perfect invalidation logic.
Common Mistake: Forgetting database connection pool sizing. Most ORMs and database drivers create a pool of connections to your database. The default pool size (often 5–10) becomes a bottleneck the moment you deploy multiple application server instances. With three app servers each maintaining a pool of 10 connections, that's 30 connections to Postgres — which has a default
max_connectionsof 100. Scale to 10 servers and you're already at the limit. Use PgBouncer (a connection pooler) in front of Postgres to manage connection multiplication at scale.
Job Workers: Keeping Your App Responsive Under Load
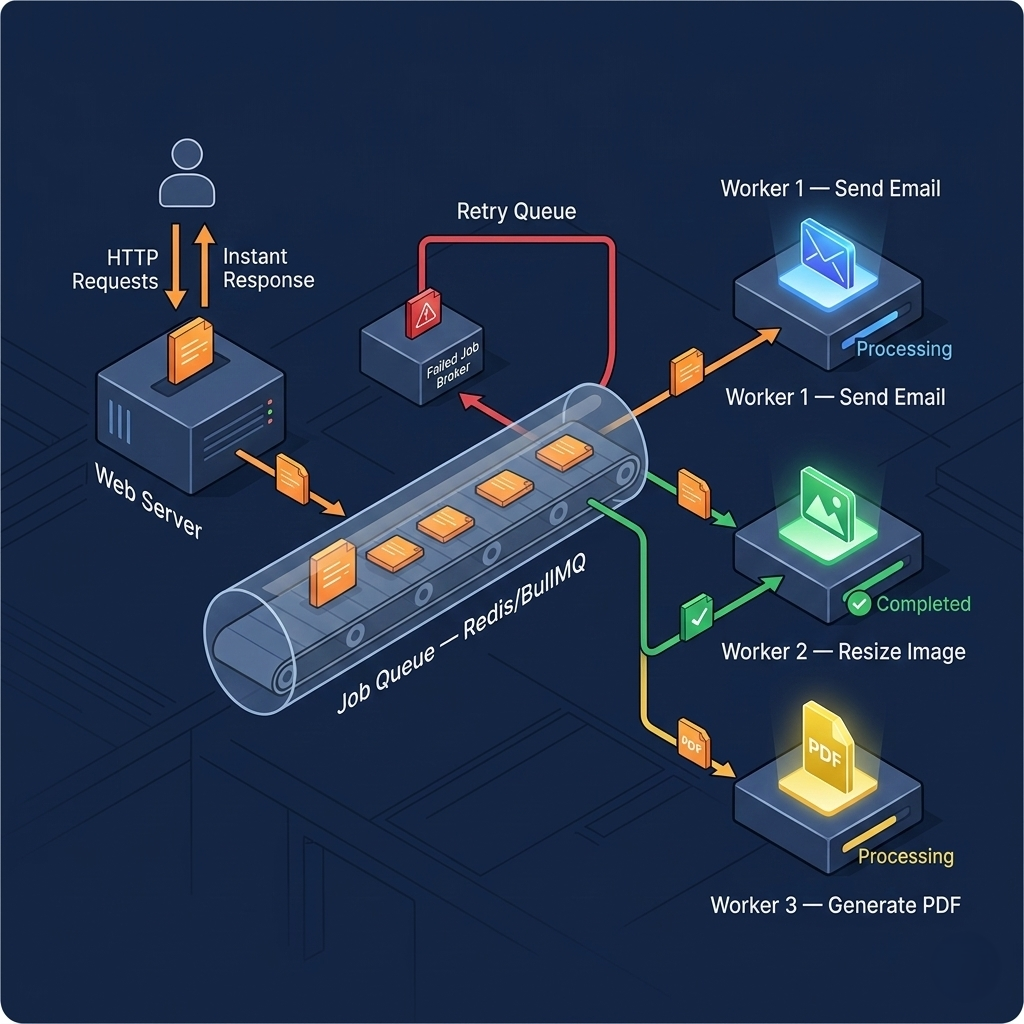
Your application receives a request to send a password reset email. Sending that email involves calling an external email API, which might take 200–800ms — sometimes more. Should your user wait for that response before seeing "Email sent!"? No. Should your web server thread sit idle while waiting for Sendgrid's API? Absolutely not.
Job workers are the solution to every operation that's too slow, too risky, or too independent to run synchronously inside an API request. The pattern is simple: instead of doing the work immediately, you push a job description onto a queue (Redis, RabbitMQ, SQS, etc.) and return immediately to the user. A separate worker process, running independently of your web servers, pulls jobs off the queue and executes them. The web server never waits. The user gets an immediate response. The work still gets done.
The use cases for job workers span nearly every type of application. Email and notification sending, image resizing and video transcoding, report generation, data imports and exports, third-party webhook deliveries, scheduled cleanup tasks, PDF generation, payment reconciliation — anything that takes longer than 100ms or that's acceptable to run asynchronously belongs in a worker. A common rule of thumb: if a task takes more than 200ms or interacts with an external service, it should be a background job.
Here's a nuance that most systems get wrong: jobs need to be idempotent. Workers can fail. Network connections drop. Processes get killed mid-job. A worker queue that retries failed jobs (which all good ones do) means your job might run twice. If "send welcome email" runs twice, the user gets two welcome emails. Your jobs must be designed so that running them multiple times produces the same result as running them once. Check if the email was already sent before sending. Use database unique constraints to prevent duplicate records. This idempotency thinking is what separates job systems that are reliable from ones that occasionally do things twice at 3 a.m.
// Bull (Redis-backed job queue) — Node.js example
const Queue = require('bull');
const emailQueue = new Queue('email', { redis: process.env.REDIS_URL });
const imageQueue = new Queue('image-processing', { redis: process.env.REDIS_URL });

// --- Producer (in your API route handler) ---
router.post('/register', async (req, res) => {
  const user = await UserService.create(req.body);

  // Don't send email synchronously — push to queue and return immediately
  await emailQueue.add('welcome', {
    userId: user.id,
    email: user.email,
    name: user.name
  }, {
    attempts: 3,           // retry up to 3 times on failure
    backoff: {
      type: 'exponential',
      delay: 2000          # wait 2s, 4s, 8s between retries
    },
    removeOnComplete: 100  # keep last 100 completed jobs for debugging
  });

  res.status(201).json({ data: user });  # instant response — don't wait for email
});

// --- Consumer (separate worker process) ---
emailQueue.process('welcome', async (job) => {
  const { userId, email, name } = job.data;

  // Idempotency check — has this email already been sent?
  const alreadySent = await db.query(
    'SELECT id FROM email_log WHERE user_id=$1 AND type=$2',
    [userId, 'welcome']
  );
  if (alreadySent.rows.length > 0) {
    console.log(`Welcome email already sent to user ${userId}, skipping`);
    return;  // idempotent — safe to call multiple times
  }

  await sendEmail({ to: email, template: 'welcome', data: { name } });
  await db.query(
    'INSERT INTO email_log (user_id, type, sent_at) VALUES ($1, $2, NOW())',
    [userId, 'welcome']
  );
});
Pro Tips & Common Mistakes — Job Workers
Pro Tip: Separate your workers by job type and resource profile. Email sending is fast and I/O-bound (waiting on external APIs). Image processing is slow and CPU-bound. Running both on the same worker processes means a sudden spike of image processing jobs can starve email sending jobs. Use separate queues with separate worker processes for jobs with different performance profiles.
Common Mistake: Not monitoring your job queues. A queue that's growing faster than workers consume it is a slow-motion disaster. Set up alerting on queue depth (PagerDuty alert when the email queue exceeds 1,000 jobs and isn't draining). Bull provides a web UI (bull-board) and Prometheus metrics endpoint for queue monitoring. Your job system is part of your production infrastructure — treat it like one.
Search Functionality: Finding Needles in Haystacks
SQL LIKE queries work for small datasets. They stop working — gradually, then suddenly — around 100,000 records, and catastrophically on anything larger. At the point where your users expect sub-100ms search results across millions of documents with typo tolerance, partial matching, relevance ranking, and faceted filtering, you need a dedicated search engine.
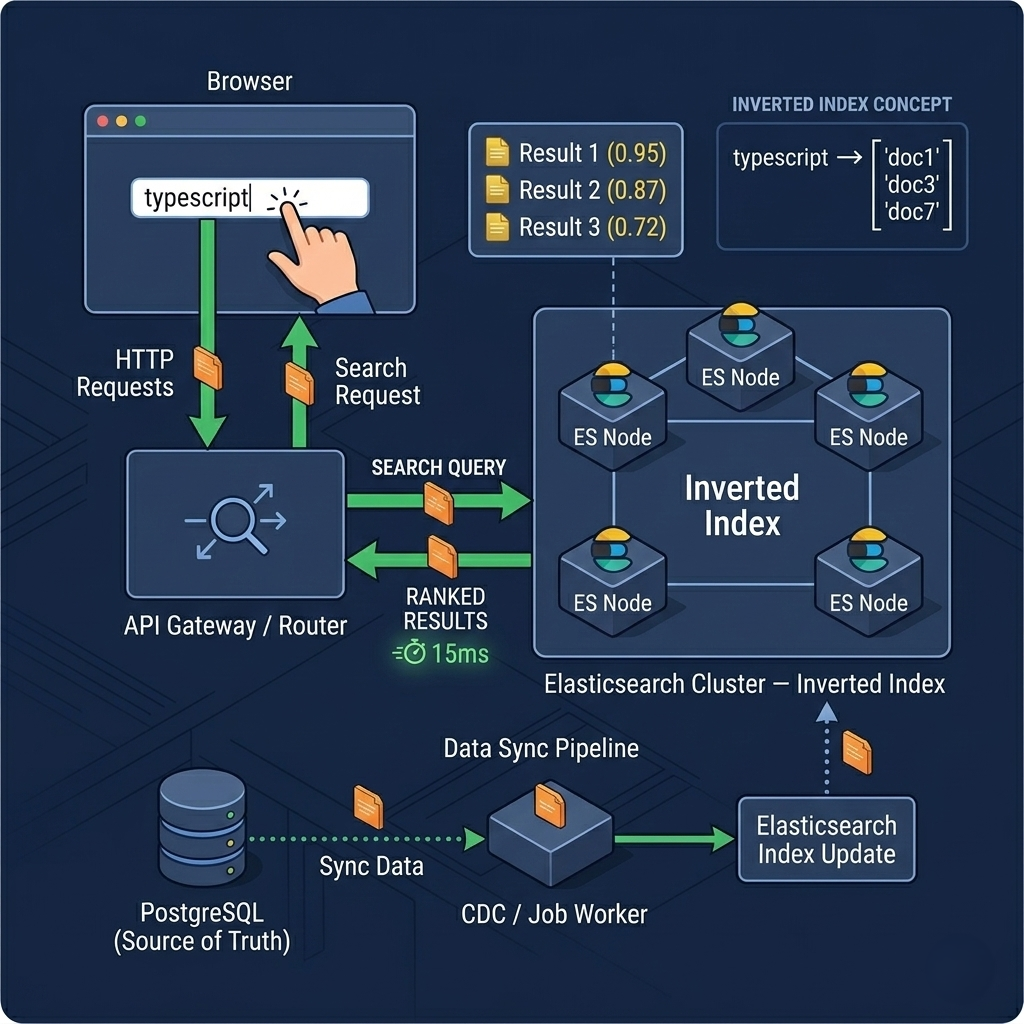
Elasticsearch (and its managed variants like OpenSearch) is the production standard for full-text search. It's a distributed search and analytics engine built on Apache Lucene, capable of indexing millions of documents and returning relevant results in single-digit milliseconds. Under the hood, Elasticsearch builds an inverted index — a data structure that maps every word to the documents containing it — making "find all documents containing the word 'typescript'" a trivial lookup rather than a full table scan.
The power of a dedicated search engine over database LIKE queries isn't just speed — it's intelligence. Elasticsearch handles stemming (matching "running" and "run"), synonyms ("couch" and "sofa"), fuzzy matching (finding "elasticsearch" when you type "elasticsaerch"), field boosting (titles matter more than body text), faceted aggregations (filter results by category, price range, date), and geo-distance queries. None of these are reasonably implementable with SQL LIKE queries. They require a search engine designed specifically for these problems.
The architecture pattern is to run Elasticsearch as a secondary data store synchronized from your primary database. Your Postgres database remains the source of truth. When records are created, updated, or deleted, your application (or a background job) replicates those changes to the Elasticsearch index. This dual-write or change-data-capture (CDC) pattern ensures your primary data is always safe and durable in Postgres while your search experience uses Elasticsearch's optimized retrieval.
// Elasticsearch integration — product search with relevance and filters
const { Client } = require('@elastic/elasticsearch');
const esClient = new Client({ node: process.env.ELASTICSEARCH_URL });

// Index a product when created/updated (called from job worker)
async function indexProduct(product) {
  await esClient.index({
    index: 'products',
    id: product.id.toString(),
    document: {
      id: product.id,
      name: product.name,
      description: product.description,
      category: product.category,
      price: product.price,
      tags: product.tags,
      created_at: product.created_at
    }
  });
}

// Full-text search with filters and relevance scoring
async function searchProducts({ query, category, maxPrice, page = 1 }) {
  const from = (page - 1) * 20;

  const response = await esClient.search({
    index: 'products',
    body: {
      from,
      size: 20,
      query: {
        bool: {
          must: query ? [{
            multi_match: {
              query,
              fields: ['name^3', 'description', 'tags'],  // name gets 3x boost
              fuzziness: 'AUTO'  // handles typos automatically
            }
          }] : [{ match_all: {} }],
          filter: [
            ...(category ? [{ term: { category } }] : []),
            ...(maxPrice ? [{ range: { price: { lte: maxPrice } } }] : [])
          ]
        }
      },
      aggs: {
        categories: { terms: { field: 'category' } },  # faceted filter counts
        price_ranges: {
          range: {
            field: 'price',
            ranges: [{ to: 25 }, { from: 25, to: 100 }, { from: 100 }]
          }
        }
      }
    }
  });

  return {
    hits: response.hits.hits.map(hit => ({ ...hit._source, score: hit._score })),
    total: response.hits.total.value,
    facets: response.aggregations
  };
}
Pro Tips & Common Mistakes — Search
Pro Tip: Start with PostgreSQL full-text search (
tsvector,tsquery,GIN index) before introducing Elasticsearch. For datasets under a few million rows with moderate search complexity, Postgres FTS is often sufficient and dramatically simpler to operate — no separate cluster, no sync pipeline, no dual-write logic. Add Elasticsearch when you genuinely need its advanced features (fuzzy matching, complex aggregations, distributed scale) and not before.Common Mistake: Letting your search index get out of sync with your primary database. If your sync pipeline fails silently — a job worker crashes, an update event gets dropped — users search for products that don't exist or miss products that do. Implement a periodic reconciliation job that compares record counts and checksums between Postgres and Elasticsearch, and alert when they diverge by more than an acceptable threshold.
Monitoring and Alerting: The Eyes and Ears of Production
You cannot manage what you cannot measure. Every layer of the infrastructure we've discussed can fail, degrade, or behave unexpectedly — and without monitoring, you find out from angry users or a tweet, not from your own systems. Monitoring isn't the last thing you add to a production application; it's the infrastructure that makes everything else manageable.
The modern observability stack rests on three pillars: metrics, logs, and traces. Metrics are numerical measurements over time — request rate, error rate, response time percentiles, CPU usage, queue depth, cache hit rate. Logs are structured event records — what happened, when, and with what context. Traces are end-to-end records of a single request's journey through your system, showing exactly where time was spent across every service. Prometheus collects and stores metrics; Grafana visualizes them into dashboards; your log aggregation service (Datadog, Loki, CloudWatch Logs, Elasticsearch) handles logs; Jaeger or Zipkin handles distributed traces.
Prometheus operates on a pull model — it scrapes metrics from endpoints your application and infrastructure expose, at configurable intervals. Your Node.js application exposes a /metrics endpoint using the prom-client library; Prometheus polls it every 15 seconds; Grafana queries Prometheus and renders the data as time-series charts. When a metric crosses a threshold (error rate above 1%, p99 latency above 2 seconds, queue depth above 10,000), a Prometheus alert fires — which PagerDuty routes to the on-call engineer's phone at 3 a.m. This is the chain of causation between "something broke" and "someone who can fix it wakes up."
Here's the thing most monitoring guides miss: alerting on symptoms, not causes, is the correct approach. Don't alert on "database CPU is at 80%." Alert on "API error rate is above 1% for 5 minutes." The first is a potential cause; the second is a confirmed user impact. High database CPU might be normal during a batch job. An elevated error rate is always wrong. Symptom-based alerting dramatically reduces false positives and alert fatigue — the state where engineers stop responding to alerts because most of them turn out to be noise.
// Prometheus metrics in Express.js — prom-client integration
const client = require('prom-client');
const register = new client.Registry();

// Enable default Node.js metrics (CPU, memory, event loop lag)
client.collectDefaultMetrics({ register });

// Custom business metrics
const httpRequestDuration = new client.Histogram({
  name: 'http_request_duration_seconds',
  help: 'Duration of HTTP requests in seconds',
  labelNames: ['method', 'route', 'status_code'],
  buckets: [0.001, 0.005, 0.01, 0.05, 0.1, 0.5, 1, 2, 5]
});

const httpRequestTotal = new client.Counter({
  name: 'http_requests_total',
  help: 'Total number of HTTP requests',
  labelNames: ['method', 'route', 'status_code']
});

const activeConnections = new client.Gauge({
  name: 'active_connections',
  help: 'Number of active database connections'
});

register.registerMetric(httpRequestDuration);
register.registerMetric(httpRequestTotal);
register.registerMetric(activeConnections);

// Middleware to record metrics for every request
app.use((req, res, next) => {
  const end = httpRequestDuration.startTimer();
  res.on('finish', () => {
    const labels = { method: req.method, route: req.route?.path || req.path, status_code: res.statusCode };
    end(labels);
    httpRequestTotal.inc(labels);
  });
  next();
});

// Prometheus scrape endpoint
app.get('/metrics', async (req, res) => {
  res.set('Content-Type', register.contentType);
  res.end(await register.metrics());
});

// prometheus.yml alert rule example
# alert: HighErrorRate
# expr: rate(http_requests_total{status_code=~"5.."}[5m]) / rate(http_requests_total[5m]) > 0.01
# for: 5m
# labels:
#   severity: critical
# annotations:
#   summary: "Error rate above 1% for 5 minutes"
Pro Tips & Common Mistakes — Monitoring and Alerting
Pro Tip: Use the RED method for service metrics: Rate (requests per second), Error rate (fraction of errors), Duration (response time distribution). These three metrics tell you almost everything important about any service's health and are the foundation of every meaningful Grafana dashboard. Start with RED before adding more specialized metrics.
Common Mistake: Not setting up monitoring until after your first production incident. The instinct is understandable — you're moving fast, monitoring feels like overhead. But the first time you need monitoring and don't have it, you're flying blind in the dark during the worst possible moment. Instrument your application from day one, even if your Grafana dashboards are simple. The habit of observability is more important than perfect coverage.
How It All Connects: Following a Request Through the Stack
Let's trace a single user request through the entire architecture to see how every component we've discussed participates in a real interaction.
A user in Singapore types a search query and hits Enter. The DNS lookup resolves to Cloudflare's edge network, and the CDN checks if the page shell (HTML, CSS, JavaScript bundle) is cached at the Singapore edge — it is, so those assets are served in milliseconds from a few miles away. The search query itself hits Cloudflare, which recognizes it as a dynamic request and forwards it to the load balancer at your origin.
The Nginx load balancer receives the HTTPS request, terminates SSL, and routes it to the least-loaded application server using least-connection balancing. The application server checks Redis for a cached version of the search results — there isn't one (cold query). The search request goes to Elasticsearch, which queries the inverted index, applies the fuzzy matching and relevance scoring, and returns the top 20 results in about 15ms. The application server formats the response, caches it in Redis with a 60-second TTL, and returns it through the load balancer to the Cloudflare edge to the user.
Simultaneously, the application server has emitted a metrics event to Prometheus (request duration, route, status code) and a structured log entry to the log aggregator. If the request had taken longer than 2 seconds, the Prometheus alerting rule would have fired within 5 minutes and notified the on-call engineer via PagerDuty.
Meanwhile, in the background, when the user clicked a search result and then purchased a product, the payment confirmation was processed synchronously (card charge happens in the request), but the confirmation email, order receipt, inventory update, and analytics event were all pushed to job queues and processed by workers asynchronously — completely invisible to the user, who saw an instant "Order confirmed!" response.
This is the architecture working as designed: every component in its correct role, with no single point of failure, every slow operation offloaded, every fast operation optimized.
Getting Started: Building Your Production Stack Step by Step
Here's a pragmatic, sequenced plan for building out these layers — not all at once (that way lies paralysis), but in the order that gives you the most value at each stage.
Stage 1: Foundations (Week 1–2)
# Start with a simple, deployable application
# Node.js/Express or your framework of choice
# PostgreSQL for data, Redis for sessions/caching
# Deploy on Railway, Render, or Fly.io — managed platforms that give you
# Postgres + Redis without operational overhead on day one

# Minimum viable sshd_config equivalent for your app:
# - Environment variables for all secrets (never hardcoded)
# - Database connection pooling from the start (pg-pool, PgBouncer)
# - Structured JSON logging (winston, pino) — not console.log
# - Basic /health endpoint returning 200 when DB is connected

app.get('/health', async (req, res) => {
  try {
    await db.query('SELECT 1');
    res.json({ status: 'ok', timestamp: new Date().toISOString() });
  } catch (err) {
    res.status(503).json({ status: 'unhealthy', error: err.message });
  }
});
Stage 2: CI/CD (Week 2)
# Add GitHub Actions from your first deployment
# - Run tests on every PR (prevent broken code reaching main)
# - Deploy to staging on merge to main
# - Deploy to production on tagged releases
# This discipline early prevents the "it works on my machine" culture
Stage 3: Caching (Week 3–4)
// Add Redis caching to your most expensive database queries
// Start with user sessions (move from in-memory to Redis immediately)
// Then cache: user profiles, product details, API responses from external services
// Rule of thumb: if a query runs >10ms and the same data is requested frequently, cache it
Stage 4: Job Workers (Month 2)
# Add Bull or BullMQ when you have:
# - Any email/notification sending in API request handlers
# - Any image processing or file handling
# - Any external API calls that can fail and need retry logic
# Start with one queue, one worker process, expand as needed
Stage 5: Monitoring (Month 2, in parallel with workers)
# Set up Prometheus + Grafana on day one of caring about production
# Managed options: Grafana Cloud (free tier), Datadog, New Relic, Fly Metrics
# Three dashboards to create first:
# 1. RED dashboard: request rate, error rate, duration by route
# 2. Infrastructure: CPU, memory, disk for all servers
# 3. Queue health: queue depth and worker throughput per queue

# Add PagerDuty or OpsGenie for after-hours alerting
# Rule: alert on error rate, not on resource usage
Stage 6: CDN and Load Balancing (Month 3)
# Add Cloudflare in front of your domain (15-minute setup for DNS + CDN)
# Nginx reverse proxy when you deploy your second application server
# Horizontal scaling becomes trivial once your architecture supports it
# (stateless app servers + shared Postgres + shared Redis = instant horizontal scale)
Stage 7: Search (When you need it)
# Add Elasticsearch when:
# - Users are complaining about search quality or speed
# - Your product dataset exceeds 500k items
# - You need fuzzy search, relevance ranking, or faceted filtering
# Start with Elastic Cloud (managed) to avoid operational overhead
# Add the sync pipeline: Postgres → job worker → Elasticsearch index
FAQ
Q: What is production-ready architecture for a web application?
Production-ready architecture means your application is built to handle real traffic, recover from failures, and be operated by humans who didn't write all the code. It includes: automated deployment via CI/CD, horizontal scaling via load balancers, caching to protect databases, background jobs for slow operations, monitoring to detect problems, and alerting to wake up the humans who can fix them. "Production-ready" isn't a binary state — it's a spectrum, and you add layers as your scale and reliability requirements grow.
Q: Do I need all these components from day one?
No — and trying to build everything upfront is a common over-engineering trap. Start with a well-structured application, a managed database, structured logging, and a CI/CD pipeline. Add caching when your database query times become noticeable. Add job workers when you have slow synchronous operations. Add search when SQL LIKE isn't good enough. Add load balancing when one server isn't enough. Grow the architecture in response to real needs, not hypothetical scale.
Q: What's the difference between a load balancer and a reverse proxy?
They're often the same software (Nginx does both) but serve different purposes. A load balancer distributes traffic across multiple backend servers, preventing any single server from being overwhelmed. A reverse proxy sits in front of your application and handles concerns like SSL termination, compression, rate limiting, caching of static files, and request routing. In production, you typically want both — Nginx configured as a reverse proxy that also load-balances across your app servers.
Q: When should I use Redis versus just querying the database?
Cache data in Redis when it's read frequently, changes infrequently, and is expensive to compute or query. Good candidates: user profiles (read on every authenticated request), product catalogs (read constantly, rarely updated), API responses from slow external services (cache for a few minutes), and computed aggregates (total order counts, average ratings). Don't cache: data that must be real-time accurate (current inventory counts, account balances), data that changes on every request (active session counts), or data with complex invalidation logic you can't maintain.
Q: How do job workers handle failures and retries?
Quality job queue libraries (Bull, Sidekiq, Celery) handle failures through configurable retry policies. When a job throws an error, it's returned to the queue with a delay before the next attempt. You configure the number of retries (usually 3–5) and the backoff strategy (exponential is standard — wait 2s, then 4s, then 8s). After all retries are exhausted, the job moves to a "dead letter queue" for manual investigation. The critical design requirement is idempotency — jobs must be safe to retry, meaning running the same job twice should produce the same result as running it once.
Q: What's the difference between Prometheus metrics and application logs?
Logs are discrete events: "User 42 authenticated at 14:23:07," "Payment failed with error: card_declined," "Cache miss for key user:profile:99." They're useful for debugging specific incidents and auditing specific events. Metrics are aggregated numerical measurements over time: "API served 847 requests in the last minute," "Error rate is 0.3%," "p99 response time is 145ms." They're useful for understanding system health trends and triggering alerts. Production observability requires both: metrics for detecting problems, logs for diagnosing them.
Q: Should I use microservices or a monolith for my production app?
Start with a monolith — specifically a well-organized "modular monolith" with clear internal service boundaries. Microservices solve organizational scale (many independent teams) and operational scale (independently scaling specific services) — problems most teams don't have when starting out. The operational overhead of microservices (service discovery, distributed tracing, network latency between services, independent CI/CD pipelines, distributed transaction management) is substantial. Build a clean monolith, establish clear module boundaries, and extract services only when you have a concrete reason that outweighs the added complexity.
Q: What monitoring should I set up first?
Start with the RED method for your API: Request rate, Error rate, Duration (response time percentiles). Add infrastructure metrics: CPU, memory, and disk for every server. Add queue depth monitoring if you use job workers. Create alerts on: error rate exceeding 1% for more than 5 minutes, p99 response time exceeding 2 seconds, any server with disk space below 20%. These basic metrics and alerts catch 90% of production incidents. Add more specialized monitoring as you understand your application's failure modes from experience.
Conclusion
The startup from the opening story eventually rebuilt their infrastructure over a frantic weekend. They added Redis caching in front of their database. They set up two application servers behind Nginx. They moved email sending to a job worker. They added basic Prometheus metrics so they could see what was actually happening. Within 48 hours, their application was handling 10x the traffic that had broken it, and they finally had the visibility to know when they were approaching limits instead of discovering them through failure.
None of those changes required exotic technology or enormous engineering effort. They required understanding the layers of a production system and knowing which layer to reach for at the right moment. That's what this architecture blueprint is: a map of the layers, what each one does, and when you need it.
The full stack — CI/CD, load balancers, CDN, modular API, database with Redis cache, job workers, Elasticsearch, and observability with Prometheus and Grafana — isn't a checklist to complete before you launch. It's a set of patterns you grow into as your application matures, your traffic grows, and your reliability requirements increase. Start simple. Add layers when they earn their place. Build the monitoring that tells you when the next layer is needed.That's how production systems are actually built — not in a grand architectural design phase, but one solved problem at a time.