
Table of Contents
- The Day My Server Died (And What I Learned About Load Balancing)
- What Is a Load Balancer — and Why "Traffic Director" Doesn't Fully Cover It
- Hardware vs. Software vs. Cloud-Based Load Balancers
- Layer 4 vs. Layer 7: The Difference That Changes Everything
- Global Server Load Balancing (GSLB): When the World Is Your Datacenter
- Load Balancing Algorithms: Picking the Right Strategy
- Monitoring Your Load Balancer: The Metrics That Actually Matter
- How It All Connects
- Getting Started: A Practical Load Balancer Setup Tutorial
- FAQ
- Conclusion
The Day My Server Died (And What I Learned About Load Balancing)
Picture this: it's Black Friday. Your e-commerce store just got featured in a newsletter with 200,000 subscribers. Orders are flying in, your team is celebrating in Slack — and then, silence. The site goes down. One server, hammered by 50,000 concurrent users, just gave up. Every request timed out. Every potential customer bounced. By the time you spun up a second instance, you'd lost $80,000 in revenue and a chunk of your reputation.
This isn't a hypothetical. It's a story that plays out at companies of every size, from scrappy startups to Fortune 500s. And the frustrating part? It's almost entirely preventable. The fix has existed for decades — it's called a load balancer, and understanding it deeply is one of the highest-leverage things you can do as a backend engineer, DevOps practitioner, or architect.
Here's the thing most tutorials miss: load balancers aren't just about "spreading traffic." They're about building systems that are resilient, intelligent, and observable — systems that degrade gracefully instead of collapsing catastrophically. This guide is going to take you all the way from first principles to production-grade setups, with real code, real analogies, and the nuance that makes the difference between a system that survives and one that doesn't.
What Is a Load Balancer — and Why "Traffic Director" Doesn't Fully Cover It
Yes, a load balancer acts as a traffic director. But calling it just that is like calling a symphony conductor someone who "waves their arms." Technically accurate. Wildly incomplete.
At its core, a load balancer sits between your users and your backend servers. Every incoming request hits the load balancer first, which then decides — based on your configured algorithm and health checks — which server should handle it. The servers behind the load balancer are called the server pool or backend pool, and from the user's perspective, they have no idea those servers exist. They just see one IP address, one domain, one seamless experience.
But what makes a load balancer genuinely powerful is what it enables beyond distribution. First, consistent performance: when one server is under heavy load, the balancer routes new requests elsewhere, so no single request gets stuck waiting behind 10,000 others. Second, dynamic scaling: you can add or remove servers from the pool without downtime. Spin up 5 new EC2 instances during a traffic spike, register them with your load balancer, and they're immediately absorbing traffic — no DNS change, no deploys, no drama. Third, reduced latency: requests go to the most available, often geographically closest, server, shaving milliseconds that compound at scale. And finally, high availability through redundancy: if one server crashes or fails a health check, the load balancer stops routing to it entirely. Your users never see the failure.
Imagine you're running a busy airport. Without a load balancer, you've got one check-in desk and an infinite queue. With one, you have a dispatcher at the entrance who looks at all the open desks and says, "Counter 7 has the shortest line — go there." Except this dispatcher also monitors which desks are open, automatically removes the ones that break down, and can direct international passengers (complex requests) to counters with translation capabilities (Layer 7 routing). That's actually closer to reality.
⚠️ Pro Tip / Common Mistake
Don't assume a load balancer alone makes you highly available. Without proper health checks configured, your load balancer will happily route traffic to a crashed server, serving 500 errors to every user it sends there. Always configure active health checks with a meaningful endpoint — not just a TCP ping, but an actual
/healthHTTP check that verifies your app is ready to serve. Set a threshold (e.g., 2 failed checks in 10 seconds) before a server is marked unhealthy and pulled from rotation.
Hardware vs. Software vs. Cloud-Based Load Balancers
Not all load balancers are created equal, and choosing the wrong type for your use case can cost you real money — either in infrastructure spend or in operational complexity. Let's break down the three categories and when each actually makes sense.
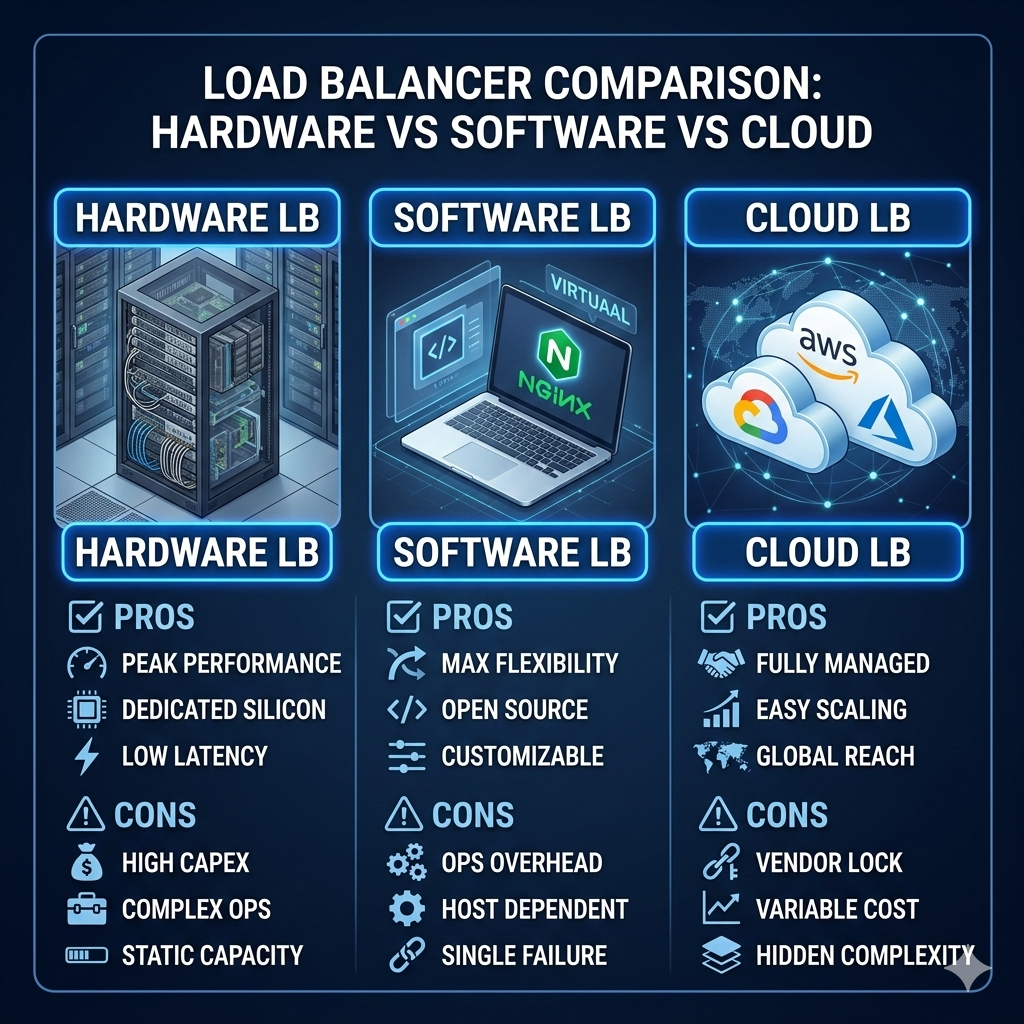
Hardware load balancers are physical appliances — dedicated machines built solely to route traffic, often from vendors like F5, Citrix, or Barracuda. They're purpose-built for extreme throughput, capable of handling millions of connections per second with sub-millisecond latency. If you're running a tier-1 financial exchange, a telecom backbone, or any environment where raw performance and physical security are non-negotiable, hardware is your world. The downsides? They're expensive (think six figures for enterprise-grade units), inflexible (scaling means buying more hardware), and require dedicated operations teams. Most modern companies don't need them.
Software load balancers run on commodity hardware or virtual machines, and this is where things get interesting for most engineers. HAProxy and NGINX are the undisputed kings here. HAProxy in particular is legendary — it's trusted by GitHub, Reddit, Stack Overflow, and Airbnb to handle massive traffic loads on ordinary servers. The flexibility is extraordinary: you can run it on a $20/month VPS, customize every routing behavior with config files, and integrate it deeply with your deployment pipeline. The operational overhead is real — you own the updates, the failover, the monitoring — but the control you gain is worth it for teams that want to own their infrastructure.
Cloud-based load balancers are managed services — AWS ALB/NLB/ELB, GCP Cloud Load Balancing, Azure Load Balancer — where the cloud provider operates the underlying infrastructure and you just configure routing rules. The operational overhead nearly vanishes. You're not patching software, managing failover, or worrying about the load balancer itself becoming a single point of failure (cloud providers typically run these across multiple availability zones by default). For most teams, especially those already on a cloud provider, this is the pragmatic choice. The trade-off is less fine-grained control and costs that can surprise you at scale.
Here's the counterintuitive insight most people miss: cloud-based load balancers and software load balancers aren't mutually exclusive. Many sophisticated architectures use a cloud load balancer at the edge (for global anycast, TLS termination, and DDoS protection) and then software load balancers internally (for microservice-to-microservice routing, advanced health checking, and circuit breaking). HAProxy running inside your Kubernetes cluster and AWS ALB at the edge is a perfectly valid and common pattern.
⚠️ Pro Tip / Common Mistake
Don't use cloud load balancers for internal microservice traffic. Routing service-to-service calls out through an external load balancer and back adds unnecessary latency and egress costs. Use a service mesh (like Istio or Linkerd) or an internal software load balancer (like Envoy) for east-west traffic inside your cluster. Reserve your cloud load balancer for north-south traffic (external users hitting your services).
Layer 4 vs. Layer 7: The Difference That Changes Everything
This is where most tutorials either gloss over the nuance or drown you in OSI model theory. Let's do neither. The distinction between Layer 4 and Layer 7 load balancing is one of the most practically important concepts in backend architecture, and the mental model that makes it click is surprisingly simple.
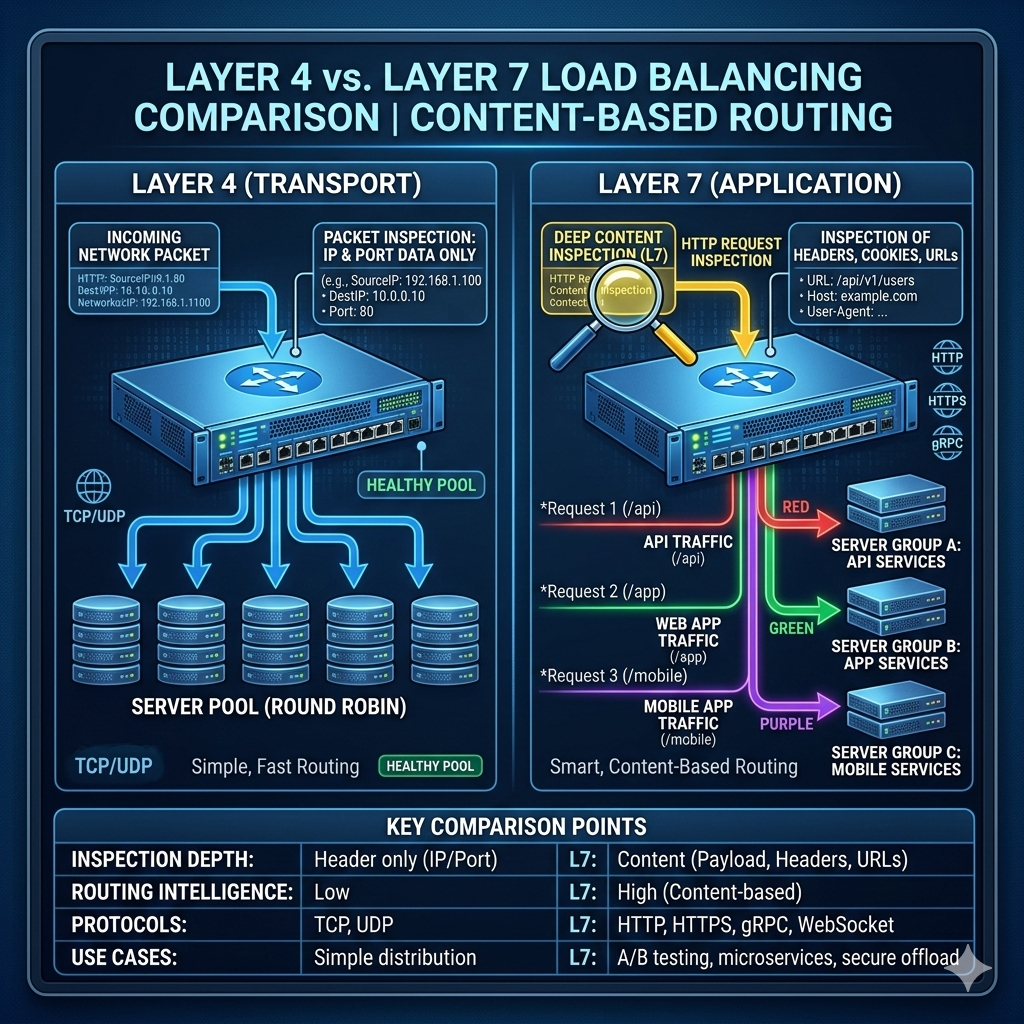
Layer 4 load balancers operate at the transport layer. They see TCP/UDP packets — IP addresses and port numbers — and nothing else. When a request comes in, the balancer makes a routing decision based purely on that information: "This packet is destined for port 443 from IP 203.0.113.42 — send it to Server B." The balancer doesn't decrypt TLS, doesn't read HTTP headers, doesn't know or care what URL you're requesting. It's fast and efficient because it does less work. It's essentially a very smart network switch. AWS Network Load Balancer (NLB) operates at Layer 4.
Layer 7 load balancers operate at the application layer. They can inspect the actual content of the request — HTTP method, URL path, headers, cookies, query parameters, even request body. This unlocks entirely different routing capabilities. Want to send all /api/* requests to your Node.js services and all /app/* requests to your React SSR servers? Layer 7. Want to route requests with a X-Beta-User: true header to a canary deployment? Layer 7. Want to route mobile users to a lite version of your app based on the User-Agent header? Layer 7. This is also where SSL/TLS termination lives — the load balancer decrypts HTTPS traffic, routes it, and can optionally re-encrypt before sending to backend servers. Your backend servers never see raw encrypted traffic, which simplifies certificate management enormously.
The performance trade-off is real but often misunderstood. Layer 7 is "slower" in the sense that it does more work per request — it has to establish a full TCP connection, potentially perform TLS handshakes, and parse HTTP headers. But in practice, for most web applications, this overhead is measured in microseconds and is completely dominated by actual application processing time. The cases where Layer 4 is meaningfully faster are raw throughput workloads: live video streaming, gaming servers, or financial tick data — scenarios where you're pushing gigabits of undifferentiated data and every microsecond counts.
# Example: Layer 7 routing with NGINX (content-based routing)
upstream api_servers {
    server api1.internal:8080;
    server api2.internal:8080;
}

upstream app_servers {
    server app1.internal:3000;
    server app2.internal:3000;
}

server {
    listen 443 ssl;
    ssl_certificate     /etc/ssl/certs/myapp.crt;
    ssl_certificate_key /etc/ssl/private/myapp.key;

    # Route /api/* to Node.js API servers
    location /api/ {
        proxy_pass http://api_servers;
        proxy_set_header Host $host;
        proxy_set_header X-Real-IP $remote_addr;
    }

    # Route everything else to React SSR servers
    location / {
        proxy_pass http://app_servers;
        proxy_set_header Host $host;
    }
}
⚠️ Pro Tip / Common Mistake
SSL termination at the load balancer is great — unless you have compliance requirements. PCI-DSS and HIPAA environments often require end-to-end encryption, meaning you can't decrypt at the load balancer and pass plaintext to backends. In that case, use SSL passthrough (Layer 4 mode, or Layer 7 with passthrough configured) and manage certificates at the application layer. Always check your compliance requirements before defaulting to termination.
Global Server Load Balancing (GSLB): When the World Is Your Datacenter
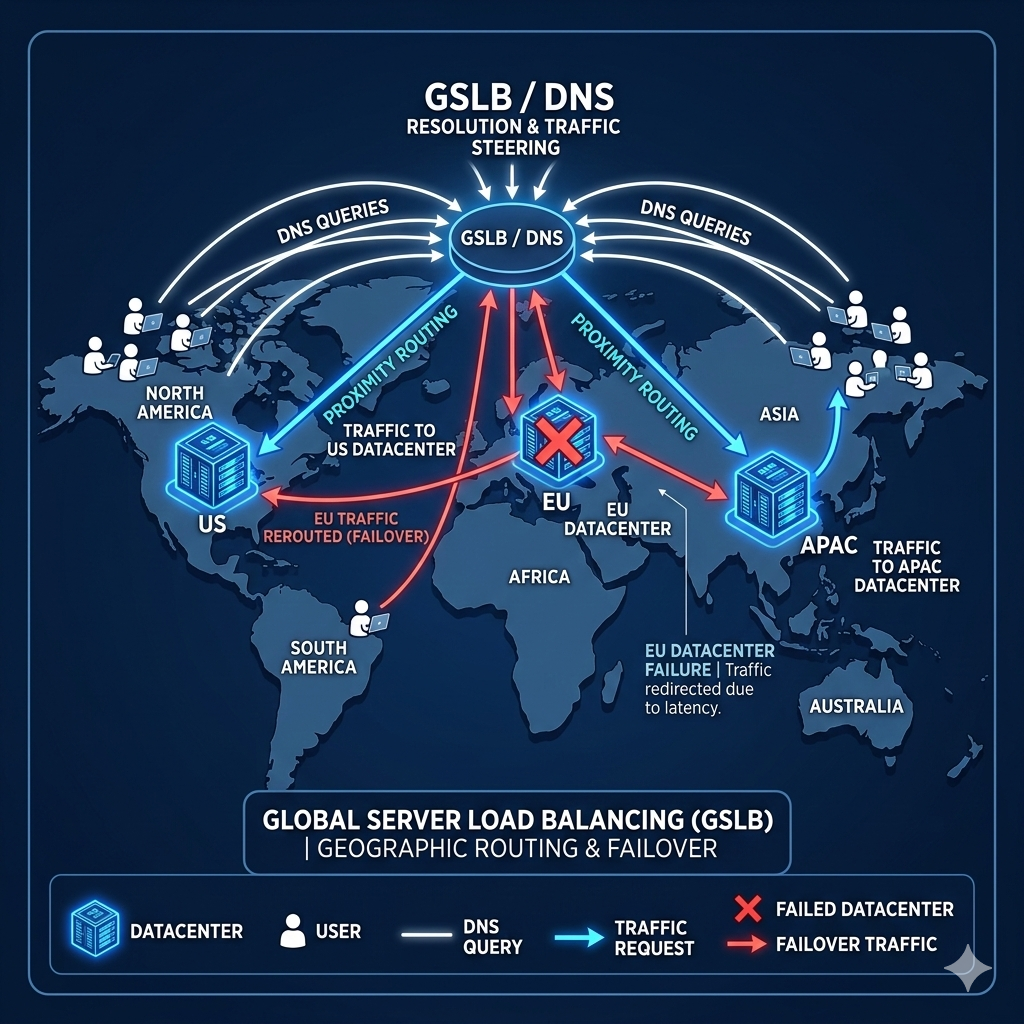
Regular load balancing handles traffic within a single location — one datacenter, one cloud region. But what happens when you have users in Tokyo, São Paulo, London, and Chicago, and you're running infrastructure in multiple cloud regions? That's where Global Server Load Balancing steps in, and it operates on a fundamentally different layer than what we've discussed so far.
GSLB typically works at the DNS level. When a user resolves your domain name, the GSLB system returns the IP address of the closest (or most appropriate) datacenter rather than a single fixed IP. This means a user in Tokyo gets routed to your Asia-Pacific region, while a user in Frankfurt gets your European datacenter — and they both experience low latency without any application-level changes. Modern implementations like AWS Route 53 with latency-based routing, Cloudflare's Anycast network, or dedicated solutions like NS1 or Akamai GTM make this remarkably accessible.
But GSLB isn't just about latency optimization. It's also about resilience at the regional level. If your US-East datacenter goes completely offline — whether from an AWS region outage, a natural disaster, or a catastrophic deployment — GSLB can detect that failure (via health checks against each region) and automatically stop routing traffic there, sending all users to US-West or EU-West instead. This is a qualitatively different kind of resilience than within-datacenter load balancing because it protects against entire-region failures, not just individual server failures.
Imagine you're running a chain of warehouses. A regular load balancer is the dock manager inside one warehouse, directing packages to different loading bays. GSLB is the logistics system that decides which warehouse to ship orders to in the first place, based on where the customer lives and which warehouses are operational. The two systems work together — GSLB gets the request to the right region, and then regional load balancers distribute it across servers within that region.
⚠️ Pro Tip / Common Mistake
DNS TTL is your biggest GSLB gotcha. When you configure GSLB for failover and your primary region goes down, clients that have cached the old DNS response (based on your TTL) will keep trying the failed IP until their cache expires. Keep your GSLB TTLs low — 30 to 60 seconds is common for production systems where failover speed matters. Yes, this means more DNS queries (and slightly more DNS infrastructure cost), but for a system that handles global traffic, it's the right trade-off.
Load Balancing Algorithms: Picking the Right Strategy
The algorithm your load balancer uses to pick a backend server is not a trivial implementation detail. It's a strategic choice that directly impacts user experience, resource utilization, and the behavior of your system under stress. Let's walk through each one with the nuance they deserve.
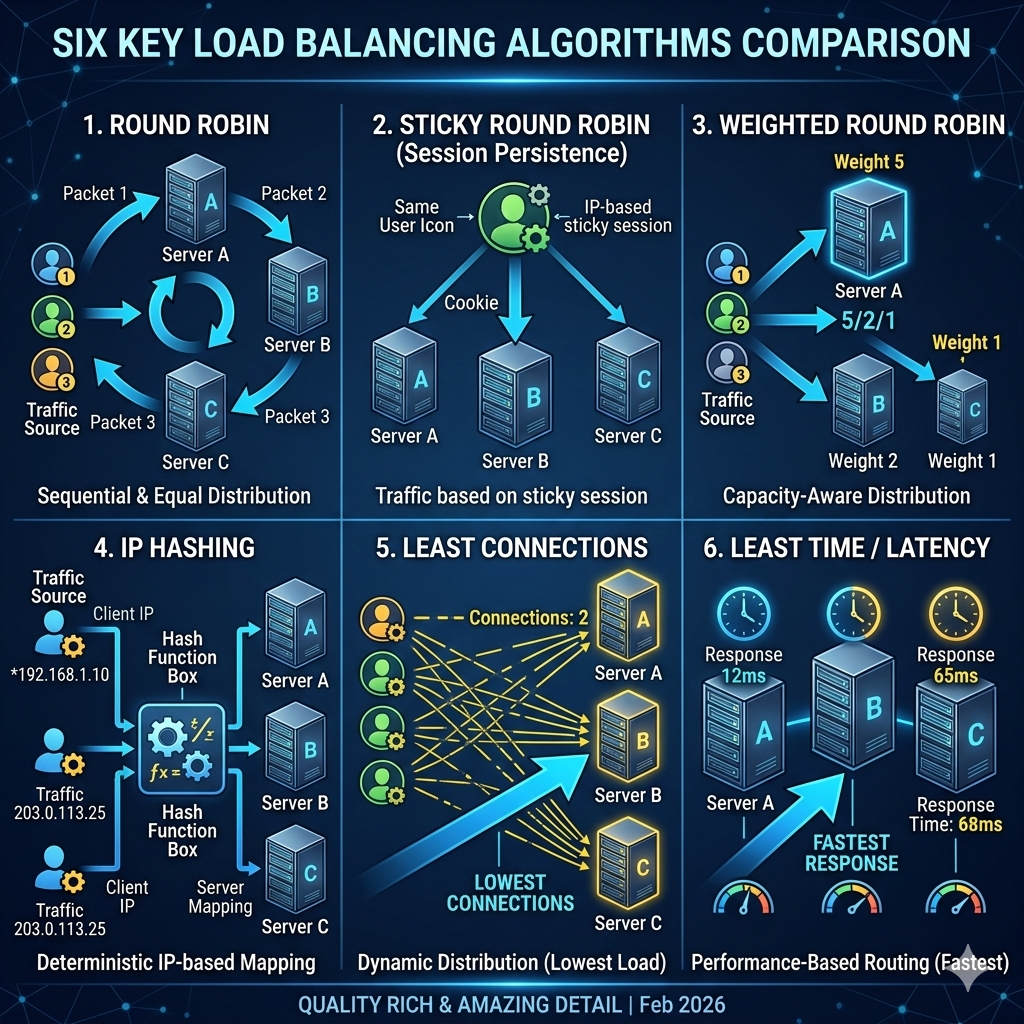
Round Robin is the simplest possible approach: request 1 goes to Server A, request 2 goes to Server B, request 3 goes to Server C, request 4 goes back to Server A. Zero state required, zero intelligence. It works beautifully when all your servers are identical in capacity and all requests are roughly equal in cost. For a fleet of homogeneous containers serving lightweight API calls, Round Robin is often the right choice — don't overthink it.
Sticky Round Robin (Session Persistence) adds one crucial behavior: once a user is assigned to a server, they keep going back to that server for the duration of their session, typically tracked via a cookie or session ID embedded in the response. Why would you want this? Stateful applications — anything that stores session data in memory rather than a shared cache. If your app stores the user's shopping cart in server memory (please don't do this, but it happens), then sending their next request to a different server means their cart disappears. Stickiness is a band-aid for stateful architectures, and while it works, it can create uneven load distribution and complicate scaling. The better long-term fix is to externalize state to Redis or a database.
Weighted Round Robin is Round Robin with a brain. You assign each server a numeric weight reflecting its capacity. A server with weight 3 gets three requests for every one that a server with weight 1 receives. This is essential in heterogeneous environments — if you have a mix of m5.xlarge and m5.4xlarge instances, you want the larger instance absorbing more traffic proportionally. It's also useful during rolling deployments: gradually increase the weight on new servers while decreasing it on old ones for a smooth, controlled migration.
IP/URL Hashing uses a hash function on the client's IP address (or a specific URL) to deterministically assign them to a server. The same IP always maps to the same server. This provides a form of stickiness without requiring any session tracking — it's stateless from the load balancer's perspective. The classic use case is caching: if you're running a reverse-proxy caching layer behind your load balancer, routing the same URLs to the same cache servers maximizes cache hit rates.
Least Connections is where things get genuinely intelligent. Instead of following a predetermined rotation, the load balancer tracks how many active connections each server currently has and routes new requests to whichever has the fewest. This is particularly valuable when request processing times vary significantly. Imagine a server stuck processing five 30-second database queries while another has only one — Round Robin would keep giving the busy server more work, while Least Connections would correctly favor the less-loaded one.
Least Time takes this further by factoring in response latency, not just connection count. It routes new requests to the server that has both few active connections and fast response times. This is the most sophisticated algorithm in common use and the right default for performance-sensitive applications where server response times vary due to real-world factors like GC pauses, cache warming, or background jobs.
# Illustrating weighted round robin logic in Python
class WeightedRoundRobin:
    def __init__(self, servers):
        # servers = [{"host": "server1", "weight": 3}, ...]
        self.servers = servers
        self.current_index = -1
        self.current_weight = 0
        self.max_weight = max(s["weight"] for s in servers)
        self.gcd = self._gcd_of_weights()

    def _gcd_of_weights(self):
        from math import gcd
        from functools import reduce
        return reduce(gcd, [s["weight"] for s in servers])

    def next_server(self):
        n = len(self.servers)
        while True:
            self.current_index = (self.current_index + 1) % n
            if self.current_index == 0:
                self.current_weight -= self.gcd
                if self.current_weight <= 0:
                    self.current_weight = self.max_weight
            if self.servers[self.current_index]["weight"] >= self.current_weight:
                return self.servers[self.current_index]["host"]

servers = [
    {"host": "server1", "weight": 5},  # Gets 5/8 of traffic
    {"host": "server2", "weight": 2},  # Gets 2/8 of traffic
    {"host": "server3", "weight": 1},  # Gets 1/8 of traffic
]
⚠️ Pro Tip / Common Mistake
Don't use IP Hashing if your users are behind NAT or a corporate proxy. If thousands of users share a single outgoing IP (common in offices, ISPs, and mobile networks), they'll all get routed to the same server, completely defeating the purpose of load balancing. IP Hashing works great for CDN cache routing, but be cautious using it as your primary algorithm for user-facing traffic without understanding your audience's network topology.
Monitoring Your Load Balancer: The Metrics That Actually Matter
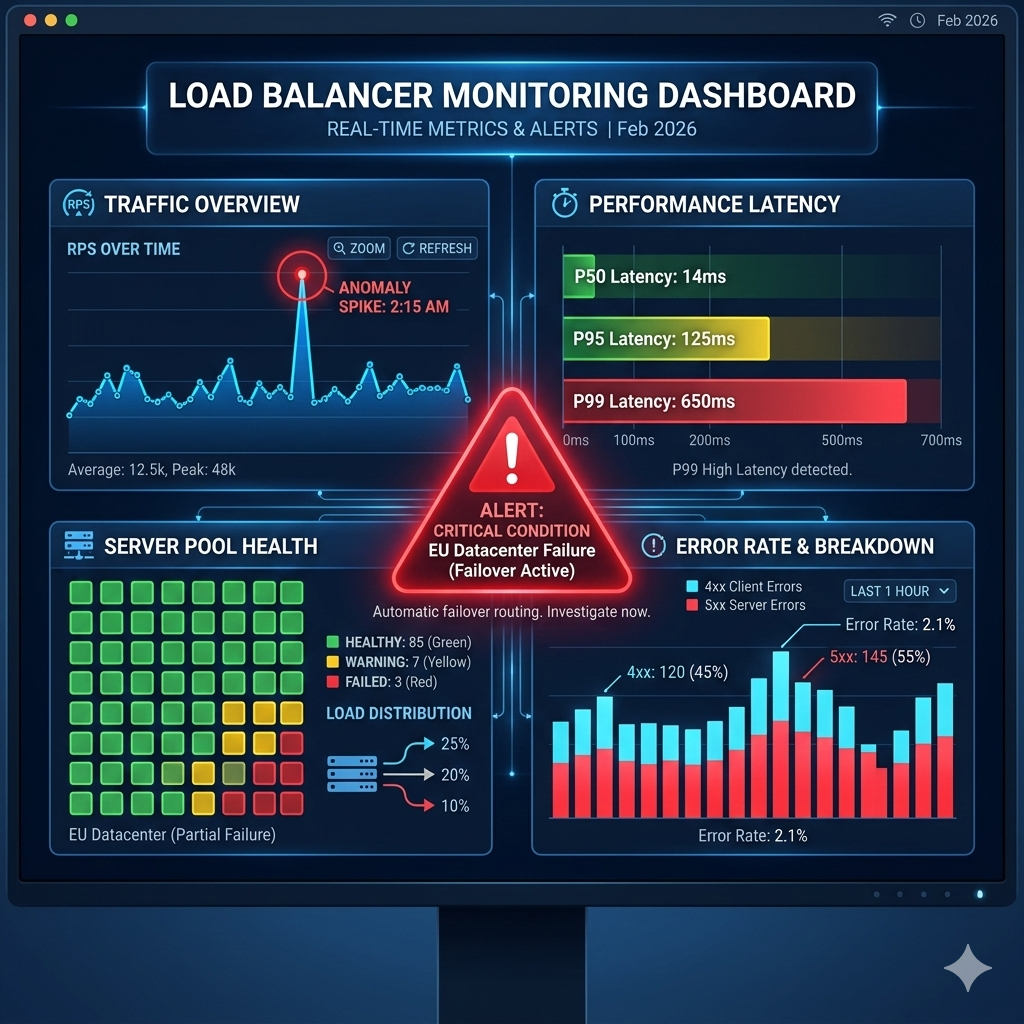
Here's the thing most tutorials miss about load balancer monitoring: the metrics that matter aren't the ones that feel important. Raw request counts are vanity. Connection counts can mislead. The metrics that actually tell you whether your system is healthy are more subtle — and missing them is how "everything looks fine" turns into a 3 AM incident.
Traffic metrics give you your baseline: requests per second, bytes in/out, and active connections. These are essential for capacity planning and detecting anomalies (a sudden 10x spike in traffic might be a DDoS or a successful marketing campaign — you want to know which). But raw numbers in isolation tell you little. Track them as time-series with anomaly detection, and set alerts based on deviation from historical baselines rather than fixed thresholds.
Performance metrics are where the signal gets sharper. Mean latency is nearly useless in production — one catastrophically slow request gets averaged out. Track p95 and p99 latency (the 95th and 99th percentile response times). If your p99 crosses 2 seconds, 1% of your users are having a terrible experience — and in a high-traffic system, 1% might be thousands of people. Also track time-to-first-byte separately from total response time to distinguish server processing time from network transfer time.
Health metrics tell you about the state of your backend pool. Track the number of servers in each state: healthy, unhealthy, and draining. Alert immediately if any server enters the unhealthy state. More importantly, track health check failure rate over time — a server that intermittently fails health checks might not trigger your alert threshold, but the pattern itself is a canary for an underlying problem (memory leak, noisy neighbor, disk filling up).
Error metrics are your most actionable signal. Track 4xx and 5xx response rates, but disaggregate them: a spike in 429s means rate limiting is triggering, a spike in 503s means your backend pool is overwhelmed, a spike in 502s often means your app servers are crashing. Your load balancer sees all of these before they reach your users — use it as an early warning system.
# Example: Prometheus alerting rules for load balancer health
groups:
  - name: load_balancer_alerts
    rules:
      - alert: HighErrorRate
        expr: |
          sum(rate(nginx_http_requests_total{status=~"5.."}[5m]))
          /
          sum(rate(nginx_http_requests_total[5m])) > 0.01
        for: 2m
        labels:
          severity: critical
        annotations:
          summary: "Error rate above 1% for 2 minutes"

      - alert: BackendServerDown
        expr: nginx_upstream_peers_down > 0
        for: 30s
        labels:
          severity: warning
        annotations:
          summary: "{{ $value }} backend server(s) marked unhealthy"

      - alert: HighP99Latency
        expr: |
          histogram_quantile(0.99,
            rate(nginx_http_request_duration_seconds_bucket[5m])
          ) > 2.0
        for: 5m
        labels:
          severity: warning
        annotations:
          summary: "P99 latency exceeds 2 seconds"
⚠️ Pro Tip / Common Mistake
Set your health check endpoint to do real work, not just return 200. An endpoint that simply returns
{"status": "ok"}tells you the web server is running — not that your app can actually serve users. A meaningful health check should verify: database connectivity, cache availability, any critical external service dependencies. But don't go too far the other way — a health check that times out because it's waiting for a slow external service will mark a perfectly healthy server as down. Use a separate "deep health check" endpoint for debugging and a "shallow" one for load balancer routing decisions.
How It All Connects
Step back for a moment and look at what we've built. A user in Singapore opens your app. Their DNS query hits your GSLB, which routes them to your Asia-Pacific region. A cloud-based Layer 7 load balancer at the edge terminates their TLS connection, inspects their HTTP headers, and — seeing a /api/ path — routes them to your API server pool. Inside that pool, a Least Connections algorithm picks the server with the fewest active connections. The selected server processes the request in 40ms. If it had failed its health check in the last cycle, the load balancer would have silently routed around it. If the entire APAC region went down, the GSLB would have redirected the user to your EU datacenter instead.
Meanwhile, your monitoring stack is tracking p99 latency, backend health status, and error rates in real time. An alert fires when p99 crosses 1.5 seconds — not because something broke, but because a noisy neighbor on one host is causing intermittent slowdowns. You catch it before a single user complains.
That's the vision. Load balancing isn't a single component — it's a philosophy of resilience built into every layer of your architecture. The algorithms, the types, the layers — they're all tools in service of one goal: keeping your application available, fast, and observable regardless of what the world throws at it.
Getting Started: A Practical Load Balancer Setup Tutorial
Let's make this real. We'll set up HAProxy as a software load balancer distributing traffic across two backend servers, with health checks, weighted routing, and monitoring configured.
Prerequisites
- Two backend servers (or two processes on the same machine for testing) running a simple HTTP service on ports 8001 and 8002
- A machine to run HAProxy (any Linux distribution)
Step 1: Install HAProxy
# Ubuntu/Debian
sudo apt update && sudo apt install -y haproxy

# Verify installation
haproxy -v
# HAProxy version 2.6.x
Step 2: Configure HAProxy
sudo nano /etc/haproxy/haproxy.cfg
Replace the contents with:
global
    log /dev/log local0
    maxconn 50000
    daemon

defaults
    mode http
    timeout connect 5s
    timeout client  30s
    timeout server  30s
    option httplog
    option dontlognull
    option forwardfor        # Pass real client IP to backends
    option http-server-close

# Statistics dashboard (available at :8080/stats)
listen stats
    bind *:8080
    stats enable
    stats uri /stats
    stats refresh 10s
    stats admin if TRUE

# Frontend: where traffic comes in
frontend http_front
    bind *:80
    default_backend http_back

    # Layer 7 routing: send /api/* to a different backend pool
    acl is_api path_beg /api/
    use_backend api_back if is_api

# Primary backend pool (weighted round robin)
backend http_back
    balance roundrobin
    option httpchk GET /health HTTP/1.1\r\nHost:\ localhost

    server web1 127.0.0.1:8001 weight 3 check inter 5s rise 2 fall 3
    server web2 127.0.0.1:8002 weight 1 check inter 5s rise 2 fall 3

# API backend pool (least connections)
backend api_back
    balance leastconn
    option httpchk GET /api/health HTTP/1.1\r\nHost:\ localhost

    server api1 127.0.0.1:8001 check inter 5s rise 2 fall 3
    server api2 127.0.0.1:8002 check inter 5s rise 2 fall 3
Step 3: Start Two Simple Backend Servers (for testing)
# server1.py — run with: python3 server1.py
from http.server import HTTPServer, BaseHTTPRequestHandler

class Handler(BaseHTTPRequestHandler):
    def do_GET(self):
        if self.path in ['/', '/health', '/api/health']:
            self.send_response(200)
            self.end_headers()
            self.wfile.write(b"Response from Server 1")
        else:
            self.send_response(404)
            self.end_headers()
    def log_message(self, fmt, *args):
        print(f"[Server 1] {fmt % args}")

HTTPServer(('', 8001), Handler).serve_forever()
# Run both servers in separate terminals
python3 server1.py &
python3 server2.py &  # change port to 8002 in the file
Step 4: Start HAProxy and Validate
# Test config before starting
sudo haproxy -c -f /etc/haproxy/haproxy.cfg

# Start the service
sudo systemctl start haproxy
sudo systemctl enable haproxy

# Check status
sudo systemctl status haproxy
Step 5: Test Load Balancing
# Send 10 requests and observe which server responds
for i in $(seq 1 10); do curl -s http://localhost/; echo ""; done

# You should see "Server 1" appearing ~3x for every "Server 2"
# (due to weight 3:1 in config)

# Test API routing
curl http://localhost/api/data
# Should route to api_back pool

# View HAProxy stats dashboard
open http://localhost:8080/stats
Step 6: Simulate a Server Failure
# Kill server 2
kill $(lsof -t -i:8002)

# Keep sending requests — all should now go to server 1
for i in $(seq 1 5); do curl -s http://localhost/; echo ""; done

# Restart server 2
python3 server2.py &

# Within 10 seconds (2 successful health checks × 5s interval),
# server 2 rejoins the pool automatically
You've just built a working Layer 7 load balancer with health checks, weighted routing, content-based routing, and automatic failover. The exact same configuration patterns apply to production HAProxy deployments handling millions of requests per day.
FAQ
What's the difference between a load balancer and a reverse proxy? A reverse proxy sits in front of servers and forwards requests on their behalf — hiding backend architecture, handling SSL, and often caching responses. A load balancer is a specific type of reverse proxy focused on distributing traffic across multiple backends. All load balancers can be reverse proxies, but not all reverse proxies load balance. NGINX and HAProxy do both.
Can a load balancer itself become a single point of failure? Yes, absolutely — and this is a real concern. For production systems, load balancers are typically deployed in active-passive or active-active pairs with a shared virtual IP (VIP). If the primary fails, a protocol like VRRP (Virtual Router Redundancy Protocol) automatically promotes the secondary. Cloud load balancers handle this transparently.
How does a load balancer handle HTTPS / TLS? There are three modes: (1) SSL Termination — the LB decrypts traffic, communicates with backends over HTTP (fastest, least secure backend path); (2) SSL Passthrough — encrypted traffic passes through the LB unread, decrypted at the backend (most secure, no content-based routing possible); (3) SSL Bridging — LB decrypts, inspects, re-encrypts before sending to backend (most flexible but most CPU-intensive).
What's the difference between a load balancer and a Kubernetes Ingress? A Kubernetes Ingress is a Layer 7 routing resource that typically uses an ingress controller (like NGINX Ingress or Traefik) to act as a load balancer inside your cluster. It handles routing traffic to different services based on hostname and path. Think of it as a load balancer configured through Kubernetes-native YAML rather than traditional config files.
How do I handle WebSocket connections with a load balancer? WebSocket connections are persistent — unlike HTTP, they don't close after each request. This means you typically want sticky sessions enabled so a given WebSocket connection isn't broken by being re-routed mid-stream. Most modern load balancers (NGINX, HAProxy, AWS ALB) have explicit WebSocket support. Make sure your health checks and timeout settings account for long-lived connections.
What is connection draining (graceful shutdown)? When you remove a server from a pool (for deployment or maintenance), connection draining lets in-flight requests finish before the server stops receiving new ones. Instead of killing active connections, the load balancer marks the server as "draining" — no new requests are sent, but existing ones complete normally. AWS and GCP call this "deregistration delay" and default to 300 seconds.
Should my microservices use a load balancer for internal calls? Yes, but probably not the same one handling your external traffic. For service-to-service (east-west) traffic inside a cluster, client-side load balancing (using libraries like gRPC's built-in LB or a service mesh like Istio/Envoy) is often more efficient. Server-side load balancers for internal traffic add a network hop and can become bottlenecks at high call rates.
What load balancer should I use on AWS? Use Application Load Balancer (ALB) for HTTP/HTTPS workloads that need content-based routing. Use Network Load Balancer (NLB) for ultra-high throughput, static IP requirements, or non-HTTP TCP/UDP protocols. Use Classic Load Balancer only if you're maintaining a legacy deployment — AWS recommends migrating to ALB or NLB.
Conclusion
Load balancers are one of those technologies where the gap between "I know what it does" and "I understand it deeply" separates systems that survive from systems that crumble. The concepts we've covered — Layer 4 vs. Layer 7, algorithms, GSLB, health checks, monitoring — aren't academic. They're decisions you make that your users feel, even if they never know why your app is fast and someone else's isn't.
The most important takeaway isn't any single algorithm or configuration tip. It's the mental model: load balancing is infrastructure for resilience, and every decision you make should serve that goal. Start with the simplest approach that fits your use case — a managed cloud load balancer with Least Connections and HTTP health checks will get you 90% of the way there. Then layer in sophistication as your requirements grow.
What to do next: Try the HAProxy tutorial above. Even just running it locally against two dummy servers will give you an intuition for load balancing that no amount of reading can replace. Once you've played with it, check out the HAProxy official documentation and the NGINX load balancing guide — both are exceptional and go miles deeper than this post.
If this guide helped you, share it with an engineer on your team who's wrestling with scaling. And if you have a load balancing story of your own — a war story, a clever configuration, a problem that took you days to debug.