
Introduction
Picture this: You're running a mission-critical Java service handling millions of requests per hour, and suddenly latency spikes because the garbage collector decided it's time for a full sweep. I've been there – paging at 2 AM, tweaking heap sizes and collector flags until dawn. Garbage collection (GC) is that invisible force in languages like Java, Python, and Go that manages memory automatically, freeing developers from manual allocation headaches while preventing leaks that could crash your app or grind performance to a halt.
Here's the thing: in February 2026, with AI workloads pushing memory limits and edge computing demanding efficiency, understanding GC isn't just academic – it's a survival skill. Poor GC tuning can lead to out-of-memory errors, unpredictable pauses, or bloated footprints, while mastery unlocks smooth, scalable systems. This post breaks it down: the reachability principle, generational hierarchies, classic and advanced algorithms, language-specific twists, and the drawbacks that still bite. Drawing from my experience optimizing JVMs for fintech and Go services for real-time analytics, I'll share advanced tips like tuning for low-latency collectors and avoiding common pitfalls. If you've ever puzzled over a GC log or wrestled with Python's ref cycles, let's reclaim that memory together.
The Core Principle: Reachability and GC Roots
At GC's heart is reachability – a simple yet powerful idea: If an object can be accessed from a "root," it's alive; otherwise, it's garbage ripe for collection. GC roots are your starting points: global variables, stack frames, thread locals, or JNI references in Java.
In practice, the collector traverses from roots, marking reachable objects – anything orphaned gets swept. This prevents leaks but demands smart implementation to avoid halting your app. From my JVM tunings, weak roots (like WeakReferences) are key for caches – they let GC reclaim when pressure hits without strong holds causing bloat.
Generational Hierarchy: Exploiting the "Most Objects Die Young" Observation
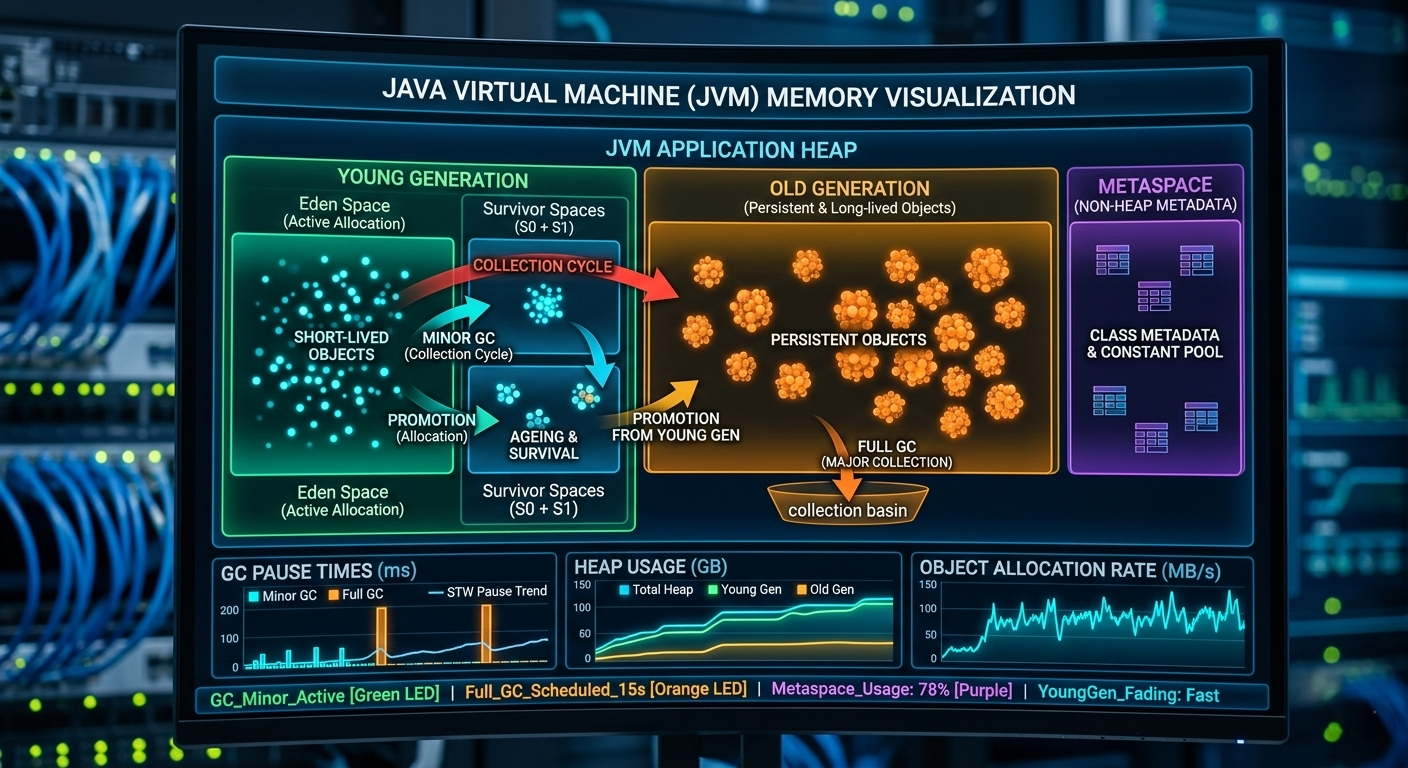
Most objects are short-lived – created, used, discarded quickly. Generational GC capitalizes on this, segmenting heap into age-based areas for efficient collection.
In Java's HotSpot JVM (still dominant in 2026 with ZGC/Shenandoah enhancements):
- Young Generation: New objects land in Eden space. Survivors move to Survivor spaces during minor GCs (fast, frequent).
- Old Generation: Long-lived objects promote here for major GCs (slower, thorough).
- Metaspace: Class metadata lives here, reducing permgen issues of old.
V8 (Node.js) and .NET CLR follow similar patterns. In my Python projects, while not strictly generational, the cyclic GC complements ref counting for "young" objects. Tip: Tune young gen size (e.g., -Xmn in Java) based on allocation rates – too small, frequent minors; too large, delayed promotions bloating old gen.
The Mark and Sweep Algorithm: Classic Reclamation
Mark-Sweep is GC 101:
- Mark Phase: From roots, traverse and flag live objects.
- Sweep Phase: Scan heap, reclaim unmarked space.
Simple, but the "stop-the-world" pause – halting app threads – kills real-time perf. In high-throughput systems I've run, this led to 100ms+ stutters, unacceptable for trading platforms.
Tricolor Mark and Sweep: Concurrency to Minimize Pauses
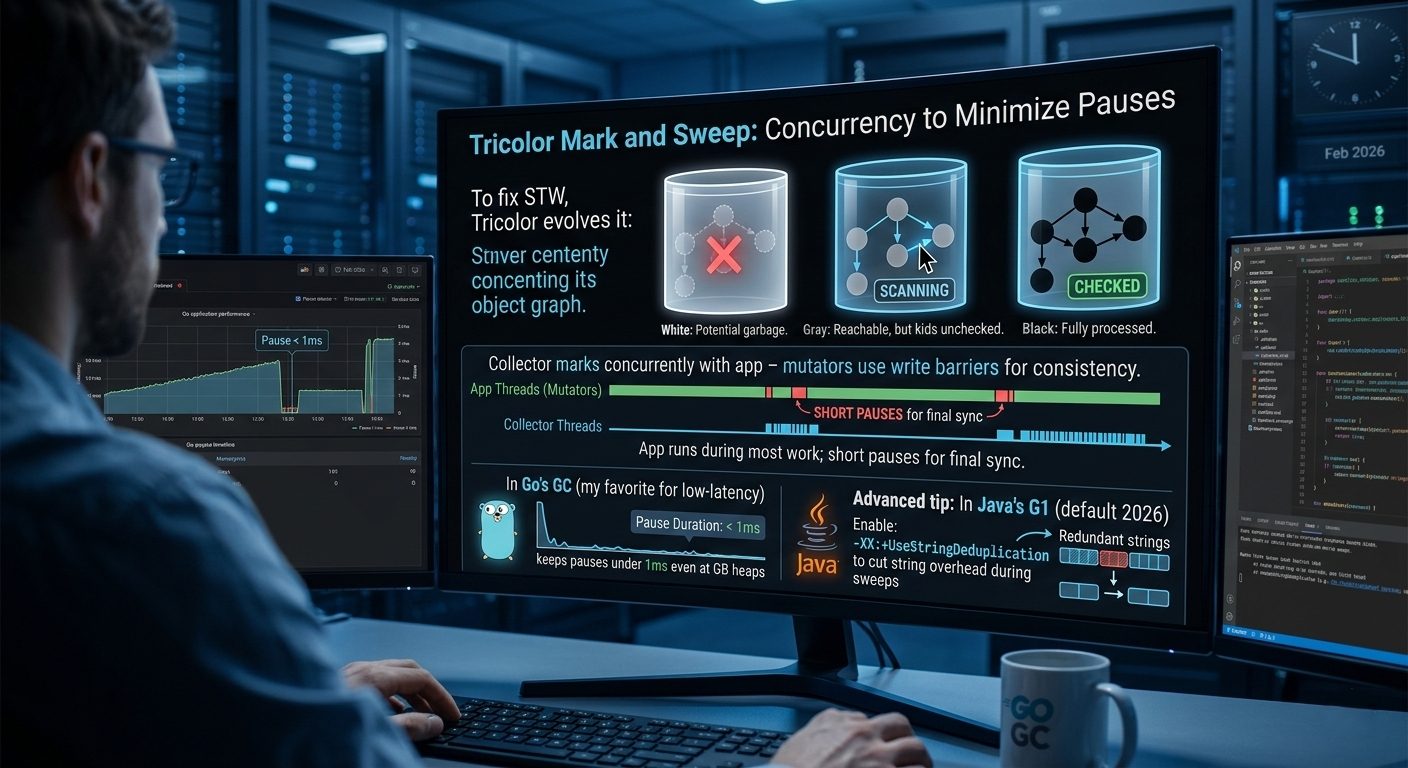
To fix STW, Tricolor evolves it:
- White: Potential garbage.
- Gray: Reachable, but kids unchecked.
- Black: Fully processed.
Collector marks concurrently with app – mutators use write barriers for consistency. App runs during most work; short pauses for final sync. In Go's GC (my favorite for low-latency), this keeps pauses under 1ms even at GB heaps. Advanced tip: In Java's G1 (default 2026), enable -XX:+UseStringDeduplication to cut string overhead during sweeps.
Language-Specific Implementations: Java, Python, Go
Java (HotSpot JVM): Offers collectors like Serial (simple, STW), Parallel (multi-thread mark-sweep), CMS (concurrent, deprecated), G1 (region-based, default), ZGC/Shenandoah (ultra-low-pause <1ms). For 2026 containerized apps, I recommend ZGC with -XX:+UseZGC – scales to TB heaps with sub-ms pauses.
Python (CPython): Ref counting for immediate dealloc (ref=0? Free it) + cyclic GC for loops (mark-sweep on suspect objects). Drawback: Ref counting overhead; I've switched to PyPy for better GC in perf-critical scripts.
Go: Concurrent tricolor mark-sweep, pacing to minimize STW (target <10ms). Write barriers ensure safety. In my Go services, -GOGC tuning (e.g., 50 for aggressive) balances memory vs CPU.
Drawbacks of Garbage Collection: The Hidden Costs
GC isn't free:
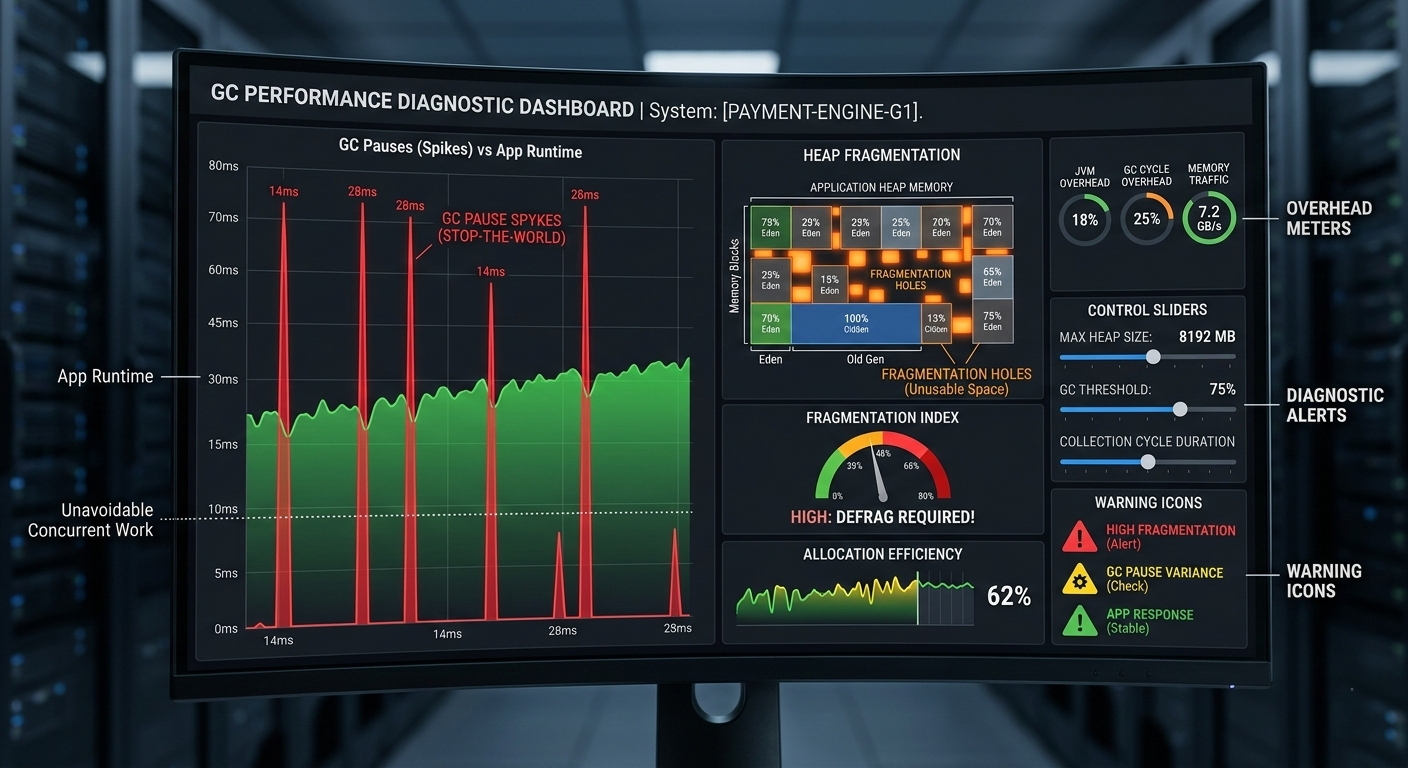
- Performance Overhead: Cycles steal CPU – in Java, tune -XX:MaxGCPauseMillis for latency.
- Memory Fragmentation: Sweep leaves holes; compactors (G1) fix but add pauses. Use -XX:+UseLargePages for better alloc.
- Loss of Control: Unpredictable pauses; for real-time, manual management (C++) or Epsilon GC (no collection, OOM on full) beats it.
In 2026, with GraalVM's ahead-of-time compilation, I've cut GC pressure 30% by reducing object churn.
Conclusion
Garbage collection is the silent guardian of managed languages, wielding reachability, generations, and algorithms to reclaim memory without manual fuss. From Java's tunable collectors to Go's concurrency, it's evolved, but drawbacks like pauses demand tuning. As a dev in 2026's memory-hungry AI era, master GC for resilient systems – profile often, experiment with flags, and remember: the best GC is the one you rarely notice.