
Table of Contents
- The 3 AM Wake-Up Call Every Engineer Dreads
- Strategy 1: Indexing — The Fastest Win You're Probably Underusing
- Strategy 2: Materialized Views — Pre-Computing Your Way to Speed
- Strategy 3: Denormalization — When Database Purity Becomes a Liability
- Strategy 4: Vertical Scaling — The Obvious First Move
- Strategy 5: Caching — Stop Asking the Database What It Already Told You
- Strategy 6: Replication — Making Copies That Actually Matter
- Strategy 7: Sharding — The Nuclear Option That's Sometimes Necessary
- How It All Connects: A Decision Framework
- Getting Started: A Practical Scaling Roadmap
- FAQ
- Conclusion
1. The 3 AM Wake-Up Call Every Engineer Dreads
It's 3:14 AM. Your phone lights up. PagerDuty. Your app — the one you've been building for two years, the one that just hit the front page of Product Hunt — is down. Response times have climbed from 80 milliseconds to 45 seconds. Users are rage-tweeting. The error logs read like a horror movie: connection timeout, query execution exceeded 30s, too many connections. And right there in the middle of it all is your database, gasping under a load it was never designed to handle.
If you've been in engineering long enough, you've either lived this night or you're going to. Databases are the most common bottleneck in growing applications — and the most misunderstood. Most engineers know vaguely that they should "add an index" or "look into caching," but when the crisis hits, that vague knowledge doesn't translate fast enough into clear decisions.
This guide is the one I wish I'd had before that kind of night. We're going to cover all seven essential database scaling strategies — not just what they are, but when to reach for each one, what breaks when you apply them wrong, and how to sequence them intelligently as your system grows. By the end, you'll have both the conceptual framework and the practical starting points to make your database survive success.
2. Strategy 1: Indexing — The Fastest Win You're Probably Underusing
Let's start with the strategy that delivers the highest return for the least architectural effort, and the one that's most consistently underused in applications that haven't been through a serious performance review: indexing.
Picture this: you walk into a library and ask for every book published by a specific author. In a library with no cataloging system, a staff member has to physically pull every book off every shelf and check the author. In a library with a proper card catalog — indexed by author name — they walk straight to the right section.
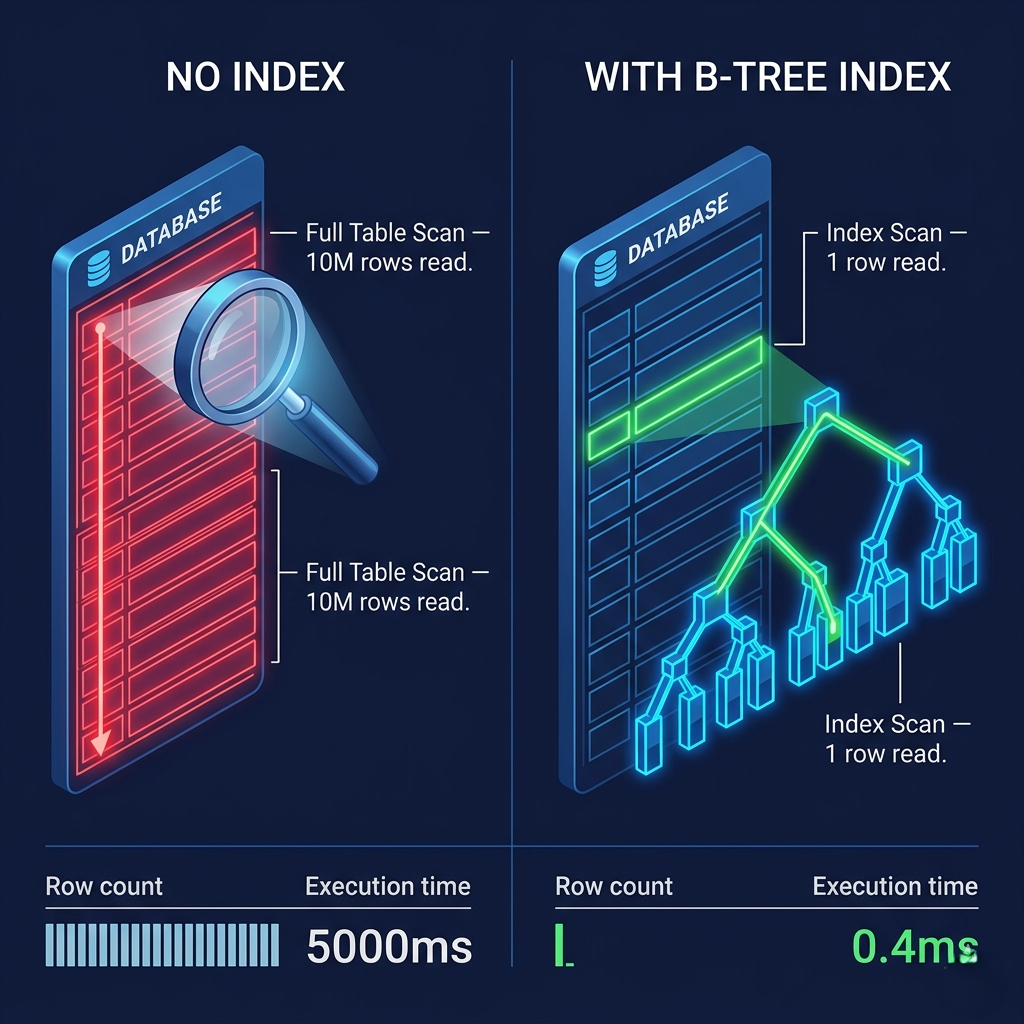
Your database is doing the same choice on every query you run. Without an index on the columns you're filtering, sorting, or joining on, the database performs a full table scan: it reads every single row to find the ones that match. On a table with ten million rows, that's ten million row reads for a query that should return two.
The most common index type is the B-tree index — a balanced tree structure that keeps data sorted and supports fast equality lookups, range queries, and ordered results. Most databases (PostgreSQL, MySQL, SQL Server) use B-tree as the default index type, and it handles the vast majority of use cases elegantly.
-- A slow query without an index — full table scan on 10M rows
EXPLAIN ANALYZE
SELECT * FROM orders WHERE customer_id = 12345;
-- Seq Scan on orders (cost=0.00..245000.00 rows=1 width=150)
-- Execution Time: 4823.412 ms

-- Create an index on the frequently queried column
CREATE INDEX CONCURRENTLY idx_orders_customer_id ON orders(customer_id);
-- CONCURRENTLY = no table lock, safe for production

-- Same query after indexing
EXPLAIN ANALYZE
SELECT * FROM orders WHERE customer_id = 12345;
-- Index Scan using idx_orders_customer_id (cost=0.56..8.58 rows=1 width=150)
-- Execution Time: 0.412 ms

-- Composite index for queries filtering on multiple columns
CREATE INDEX idx_orders_customer_date
ON orders(customer_id, order_date DESC);

-- This composite index serves this common query efficiently
SELECT * FROM orders
WHERE customer_id = 12345
AND order_date > NOW() - INTERVAL '30 days'
ORDER BY order_date DESC;

-- Partial index for a specific subset — smaller, faster
CREATE INDEX idx_orders_pending
ON orders(created_at)
WHERE status = 'pending';
-- Only indexes pending orders, not the entire table
Here's the thing most tutorials miss about indexing: the order of columns in a composite index is not arbitrary. The index (customer_id, order_date) efficiently serves queries filtering on customer_id alone or customer_id + order_date — but it does nothing for queries filtering only on order_date. The leftmost prefix rule is one of the most commonly misunderstood aspects of index design, and it's the reason many engineers create indexes that look correct but provide zero benefit for the queries they actually run.
The other nuance worth internalizing: indexes have a write cost. Every INSERT, UPDATE, or DELETE on an indexed table requires maintaining the index structure as well. On a table with fifteen indexes and a high write rate, that overhead accumulates significantly. Index design is optimization — it requires understanding your read/write ratio and your actual query patterns, not just indexing every column that ever appears in a WHERE clause.
💡 Pro Tips & Common Mistakes — Indexing
Pro Tip: Use
EXPLAIN ANALYZE(PostgreSQL) orEXPLAIN(MySQL) before and after adding indexes. Don't guess — verify that the query planner is actually using the index you created. Occasionally, the planner decides a full table scan is cheaper than an index scan for very small tables or low-selectivity queries.CREATE INDEX CONCURRENTLYin PostgreSQL builds the index without locking the table. Always use this in production. The non-concurrent version takes a write lock that will block all inserts and updates for the duration of the build.
Common Mistake: Indexing a low-cardinality column in isolation — for example, a
statuscolumn with only three possible values ('pending', 'active', 'closed'). The database often skips this index entirely because scanning an index that returns 33% of rows is slower than a sequential scan. Index columns with high cardinality (many distinct values), or use partial indexes for specific values. Never reviewing or dropping unused indexes. Every index costs write performance. Run a query againstpg_stat_user_indexesin PostgreSQL to find indexes that have never been used and drop them.
3. Strategy 2: Materialized Views — Pre-Computing Your Way to Speed
Once your indexing is solid and you're still seeing slow queries — usually the complex analytical ones involving multiple joins, aggregations, and large datasets — it's time to consider materialized views.
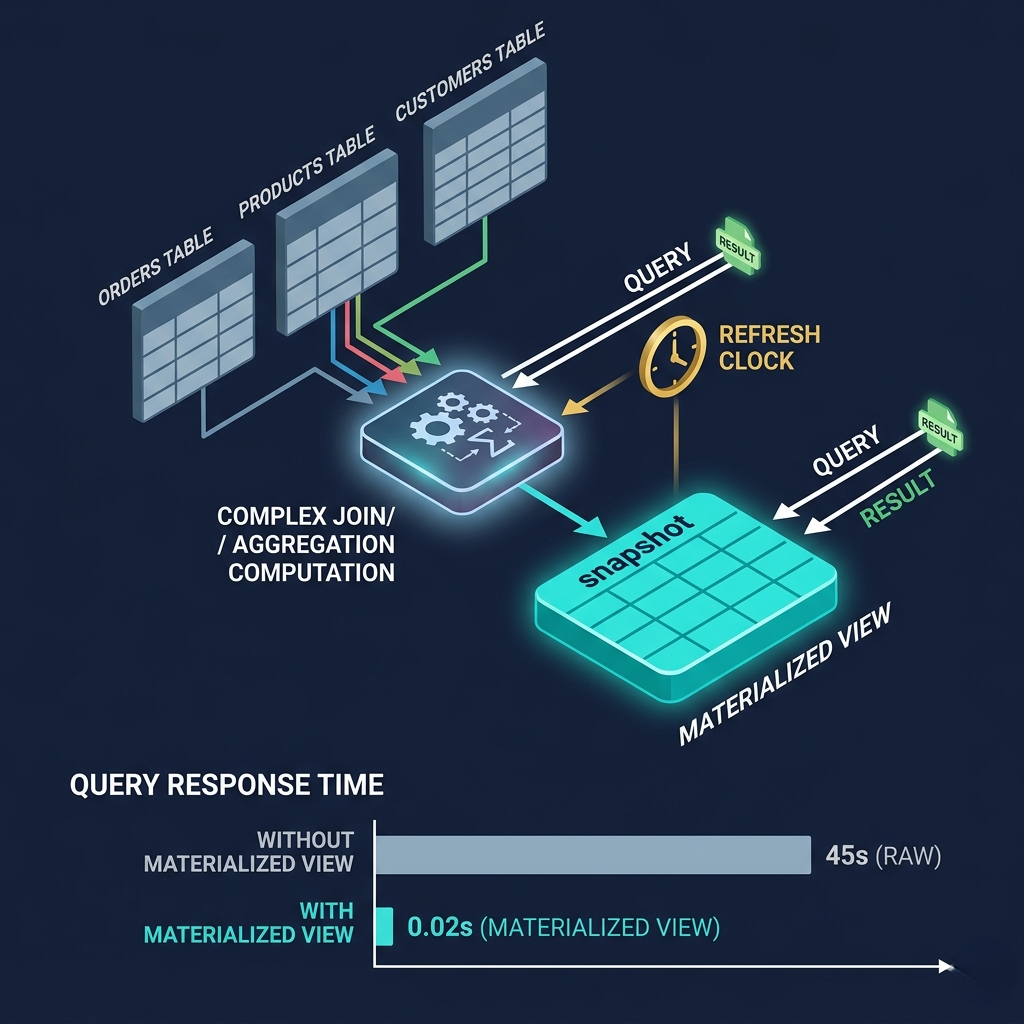
Think of a materialized view as a pre-baked report. Instead of a chef preparing a dish from raw ingredients every time someone orders it (the equivalent of running a complex query from scratch), a materialized view is a dish prepared in advance and kept warm — ready to serve instantly. The "cooking" happened once, and you get the result in milliseconds instead of seconds or minutes.
The distinction between a regular view and a materialized view is critical. A regular view is a saved query definition — when you query it, it runs the underlying query in real time. There's no performance benefit for complex queries. A materialized view physically stores the result set on disk. Querying it is just reading a pre-computed table.
-- The expensive query (runs every time someone pulls a sales report)
-- On a 50M row table, this takes 45+ seconds
SELECT
    p.category,
    DATE_TRUNC('month', o.order_date) AS month,
    COUNT(DISTINCT o.customer_id) AS unique_customers,
    SUM(oi.quantity * oi.unit_price) AS total_revenue,
    AVG(oi.quantity * oi.unit_price) AS avg_order_value
FROM orders o
JOIN order_items oi ON o.id = oi.order_id
JOIN products p ON oi.product_id = p.id
WHERE o.status = 'completed'
GROUP BY p.category, DATE_TRUNC('month', o.order_date);

-- Turn it into a materialized view — computed once, queried many times
CREATE MATERIALIZED VIEW mv_monthly_sales_by_category AS
SELECT
    p.category,
    DATE_TRUNC('month', o.order_date) AS month,
    COUNT(DISTINCT o.customer_id) AS unique_customers,
    SUM(oi.quantity * oi.unit_price) AS total_revenue,
    AVG(oi.quantity * oi.unit_price) AS avg_order_value
FROM orders o
JOIN order_items oi ON o.id = oi.order_id
JOIN products p ON oi.product_id = p.id
WHERE o.status = 'completed'
GROUP BY p.category, DATE_TRUNC('month', o.order_date)
WITH DATA;  -- Populates immediately on creation

-- Add an index on the materialized view for even faster queries
CREATE INDEX ON mv_monthly_sales_by_category(month, category);

-- Now this query returns in milliseconds
SELECT * FROM mv_monthly_sales_by_category
WHERE month = '2024-01-01'
ORDER BY total_revenue DESC;

-- Refresh when underlying data changes (schedule with pg_cron or a job queue)
REFRESH MATERIALIZED VIEW CONCURRENTLY mv_monthly_sales_by_category;
-- CONCURRENTLY allows reads during refresh (requires a unique index)
The refresh strategy is where materialized views get nuanced. REFRESH MATERIALIZED VIEW recomputes the entire result set — on a large view, this is expensive and temporarily locks the view from reads (unless you use CONCURRENTLY). CONCURRENTLY computes the new result in the background and swaps it in, but it requires a unique index on the view and takes longer overall. The right refresh frequency depends entirely on how stale your data can afford to be. For a daily sales report, refreshing nightly at 2 AM is perfect. For a real-time dashboard, a materialized view might be the wrong tool entirely.
💡 Pro Tips & Common Mistakes — Materialized Views
Pro Tip: Use
pg_cron(PostgreSQL extension) or a job scheduler like Celery or Temporal to automate materialized view refresh on a schedule. Never refresh manually in application code on every request. You can index a materialized view just like a regular table. Combine with B-tree or partial indexes on the most-queried columns for compounding performance gains.
Common Mistake: Assuming materialized views are a substitute for proper query optimization. If a query is slow because of a missing join index on the underlying tables, fix the underlying tables first. Materialized views are for queries that are inherently expensive due to data volume and aggregation complexity. Using materialized views for data that changes frequently (every few seconds). The refresh overhead will negate the read performance gains. Use Redis or an application-level cache for high-churn data instead.
4. Strategy 3: Denormalization — When Database Purity Becomes a Liability
Every database textbook teaches normalization — the process of organizing data to eliminate redundancy, ensure integrity, and keep every piece of information in one canonical place. And for most of the lifecycle of most applications, normalization is the right choice. But here's the counterintuitive insight that most database tutorials bury in a footnote: at high enough read volumes, normalization becomes the enemy of performance.
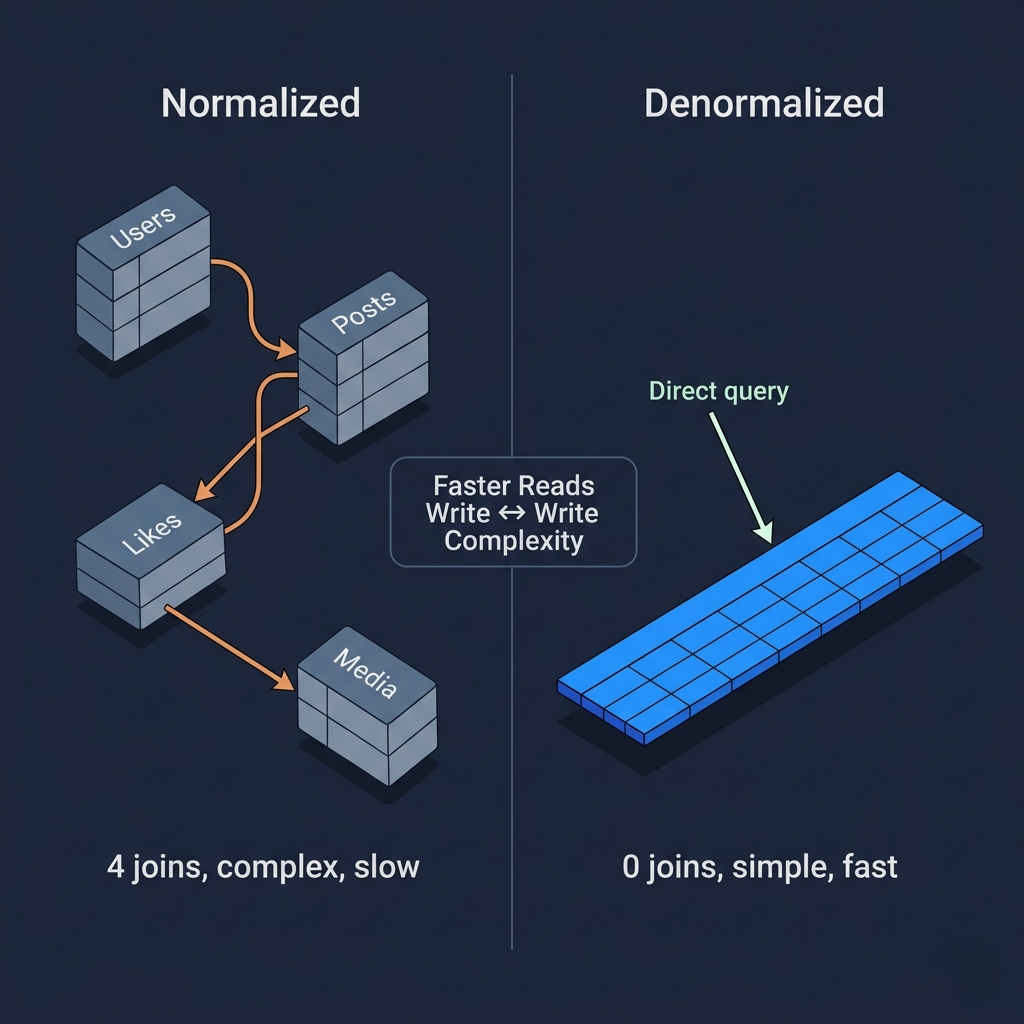
The problem with highly normalized databases is joins. When your data is perfectly normalized, answering a user's question requires assembling the answer from multiple tables — customers, orders, order_items, products, categories, maybe shipping addresses, maybe promotions. Each join is additional computational work, additional I/O, and additional complexity for the query planner. On a 10,000-row database, this is negligible. On a 500-million-row database with thousands of concurrent users, those joins become the bottleneck that no amount of indexing can fully fix.
Denormalization is the deliberate choice to store some data redundantly — to embed a copy of a value in a table where it's frequently needed alongside other data, instead of always joining back to the source. Consider a user_feed table on a social platform. In a normalized design, you'd store only the post_id and user_id, and join to the posts and users tables every time you render the feed. In a denormalized design, you'd store the author's username and avatar URL directly in the feed table — accepting that if the user changes their username, you now need to update it in multiple places.
-- Normalized design — correct, but slow for feed queries
-- Requires 3 joins to render a single feed item
SELECT
    f.post_id,
    p.content,
    p.image_url,
    p.created_at,
    u.username,
    u.avatar_url,
    COUNT(l.id) AS like_count
FROM user_feed f
JOIN posts p ON f.post_id = p.id
JOIN users u ON p.user_id = u.id
LEFT JOIN likes l ON p.id = l.post_id
WHERE f.follower_id = 12345
ORDER BY p.created_at DESC
LIMIT 20;

-- Denormalized design — redundant storage, but a single table scan
CREATE TABLE user_feed_denormalized (
    follower_id     BIGINT,
    post_id         BIGINT,
    content         TEXT,
    image_url       VARCHAR(500),
    post_created_at TIMESTAMP,
    author_id       BIGINT,
    author_username VARCHAR(100),   -- Redundant — also in users table
    author_avatar   VARCHAR(500),   -- Redundant — also in users table
    like_count      INT DEFAULT 0,  -- Redundant — also computable from likes table
    PRIMARY KEY (follower_id, post_id)
);

-- Feed query is now trivially fast — no joins
SELECT * FROM user_feed_denormalized
WHERE follower_id = 12345
ORDER BY post_created_at DESC
LIMIT 20;

-- Trade-off: when a user changes their avatar, you must update all feed rows
UPDATE user_feed_denormalized
SET author_avatar = 'https://cdn.example.com/new-avatar.jpg'
WHERE author_id = 67890;
-- This could touch millions of rows — plan accordingly
The architectural implication is clear: denormalization shifts complexity from reads to writes. Your reads become blazing fast and simple. Your writes become more complex — every update to a source record potentially needs to propagate to denormalized copies. This trade-off is almost always worth it when read volume vastly outweighs write volume, which is the case for social feeds, product listings, and most user-facing content displays.
💡 Pro Tips & Common Mistakes — Denormalization
Pro Tip: Denormalize only the data that changes rarely. Usernames and avatar URLs change infrequently — good candidates. Product prices change frequently — dangerous to denormalize without an extremely robust update propagation strategy. Use event-driven architecture (Kafka, RabbitMQ, or database triggers) to propagate denormalized updates automatically when source data changes. Don't rely on application code remembering to update every denormalized copy — it will forget, and you'll have stale data.
Common Mistake: Denormalizing prematurely. Don't do this before you've exhausted indexing and query optimization. Denormalization significantly increases application complexity and data consistency risk. Apply it only to proven hot paths where joins are the measured bottleneck. Denormalizing frequently-changing financial data. If a product's price is stored in ten places and a pricing update only propagates to eight, you have a serious data integrity problem. Use denormalization conservatively with high-change-rate data.
5. Strategy 4: Vertical Scaling — The Obvious First Move
Imagine you're running a busy restaurant kitchen. Orders are coming in faster than you can handle them. The first thing any sensible owner does isn't tear down the kitchen and rebuild it — they buy a faster stove, hire a stronger sous chef, and get a bigger refrigerator. That's vertical scaling: making the existing machine bigger and faster before you consider more radical architectural changes.
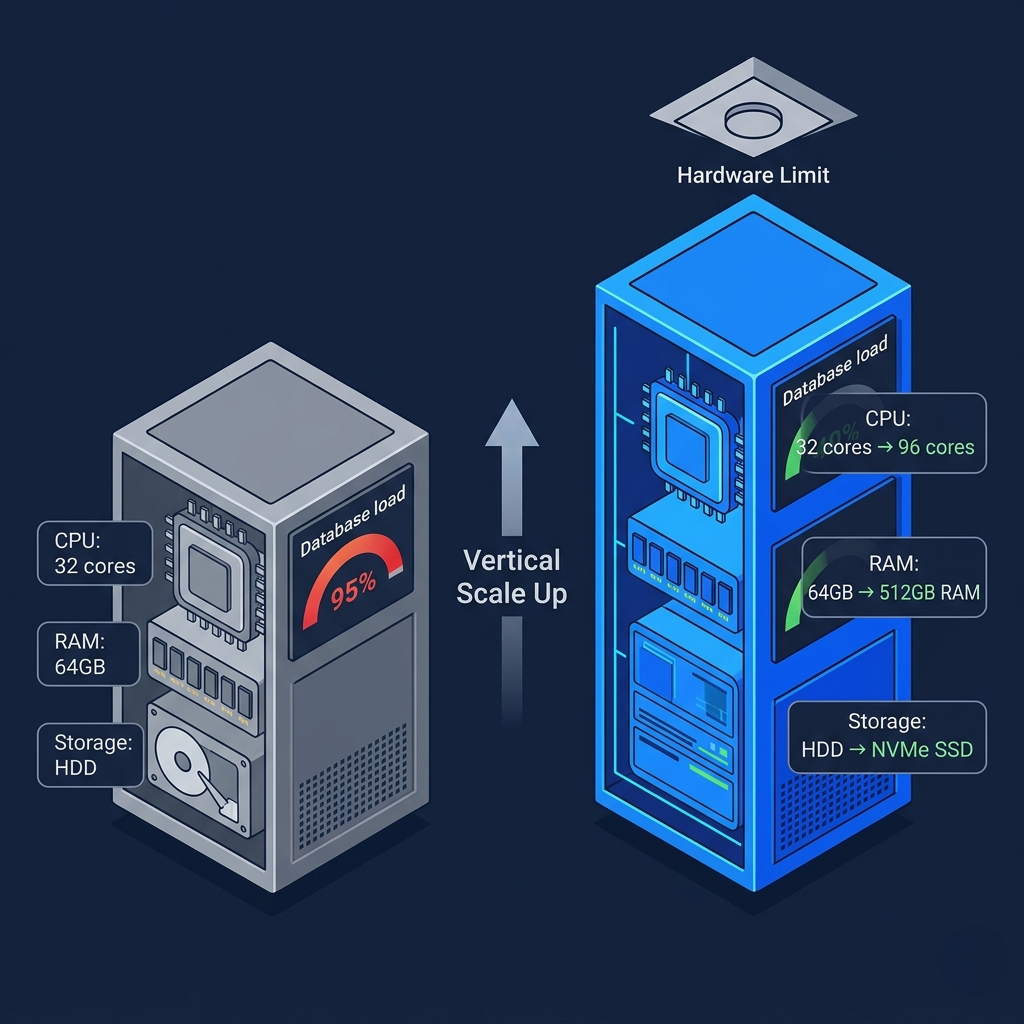
In database terms, vertical scaling means upgrading the hardware your database runs on: more CPU cores, more RAM, faster SSDs, higher network bandwidth. It sounds almost too simple to be worth discussing in a serious architecture guide. But here's the thing: vertical scaling is chronically underestimated by engineers who are excited about distributed systems, and chronically overused by teams who apply it past its appropriate window just to avoid architectural complexity.
The case for vertical scaling as your first move is strong. It requires zero changes to application code, zero changes to database configuration (usually), and delivers immediate, measurable improvement. Doubling RAM from 64GB to 128GB dramatically increases the database's buffer pool — the in-memory cache of data pages — which means far fewer disk reads for frequently-accessed data. Upgrading from HDD to NVMe SSD can reduce I/O latency by 10–100× for the same query workload. These are real, compounding gains with minimal risk.
# PostgreSQL — checking current memory configuration
psql -c "SHOW shared_buffers;"           # Should be ~25% of total RAM
psql -c "SHOW effective_cache_size;"     # Should be ~75% of total RAM
psql -c "SHOW work_mem;"                 # Per-operation sort/hash memory

# After vertical scaling (e.g., 32GB → 128GB RAM), update postgresql.conf
# Old settings (32GB server):
# shared_buffers = 8GB
# effective_cache_size = 24GB
# work_mem = 64MB

# New settings (128GB server):
shared_buffers = 32GB           # 25% of 128GB
effective_cache_size = 96GB     # 75% of 128GB
work_mem = 256MB               # More memory per sort/hash operation
max_connections = 500          # Can handle more concurrent connections
wal_buffers = 64MB             # Faster write-ahead logging

# Reload config without restart
psql -c "SELECT pg_reload_conf();"

# Check if buffer cache is being hit (should be > 99% for hot data)
SELECT
    sum(heap_blks_read) as heap_read,
    sum(heap_blks_hit)  as heap_hit,
    round(
        sum(heap_blks_hit) * 100.0 /
        (sum(heap_blks_hit) + sum(heap_blks_read)), 2
    ) as cache_hit_ratio
FROM pg_stattio_user_tables;
-- Target: > 99% for OLTP workloads
The ceiling of vertical scaling is real and worth planning around. At a certain point — typically when you're running a 96-core, 2TB-RAM instance on AWS or Azure — the cost per additional unit of performance becomes prohibitive, and the risk of running everything on a single machine (a hardware failure takes down your entire database) becomes an architectural liability. Vertical scaling also does nothing for write throughput limits imposed by single-node disk I/O. When you start hitting these ceilings, the next strategies become necessary. Vertical scaling buys you time. Use that time to implement the architectural strategies below.
💡 Pro Tips & Common Mistakes — Vertical Scaling
Pro Tip: When upgrading hardware on a managed database (AWS RDS, Google Cloud SQL, Azure Database), use the maintenance window feature and enable Multi-AZ standby before any instance type change. Upgrades involve a brief failover — Multi-AZ cuts downtime from minutes to seconds. After vertical scaling, always re-tune database memory parameters. Many teams upgrade the server but never update
shared_buffers,work_mem, oreffective_cache_size, leaving significant performance on the table.
Common Mistake: Using vertical scaling as a substitute for fixing inefficient queries. Throwing hardware at a missing index or an N+1 query problem is expensive and temporary. Fix the query first — vertical scaling is for when the queries are already optimal and volume is the constraint.
Not having a failover strategy in place before your database is on a large vertical instance. A single beefy server with no replica is a single point of failure. Vertical scaling and replication should go together.
6. Strategy 5: Caching — Stop Asking the Database What It Already Told You
There's a quiet inefficiency running in most web applications right now, and it's almost embarrassing once you see it: the same database query being executed thousands of times per minute, returning the exact same result every single time. A product listing page that hasn't changed in six hours. A user's profile data fetched on every page load. A list of navigation categories recomputed from the database on every request. The database is answering the same question over and over, burning CPU and I/O on work it already did.
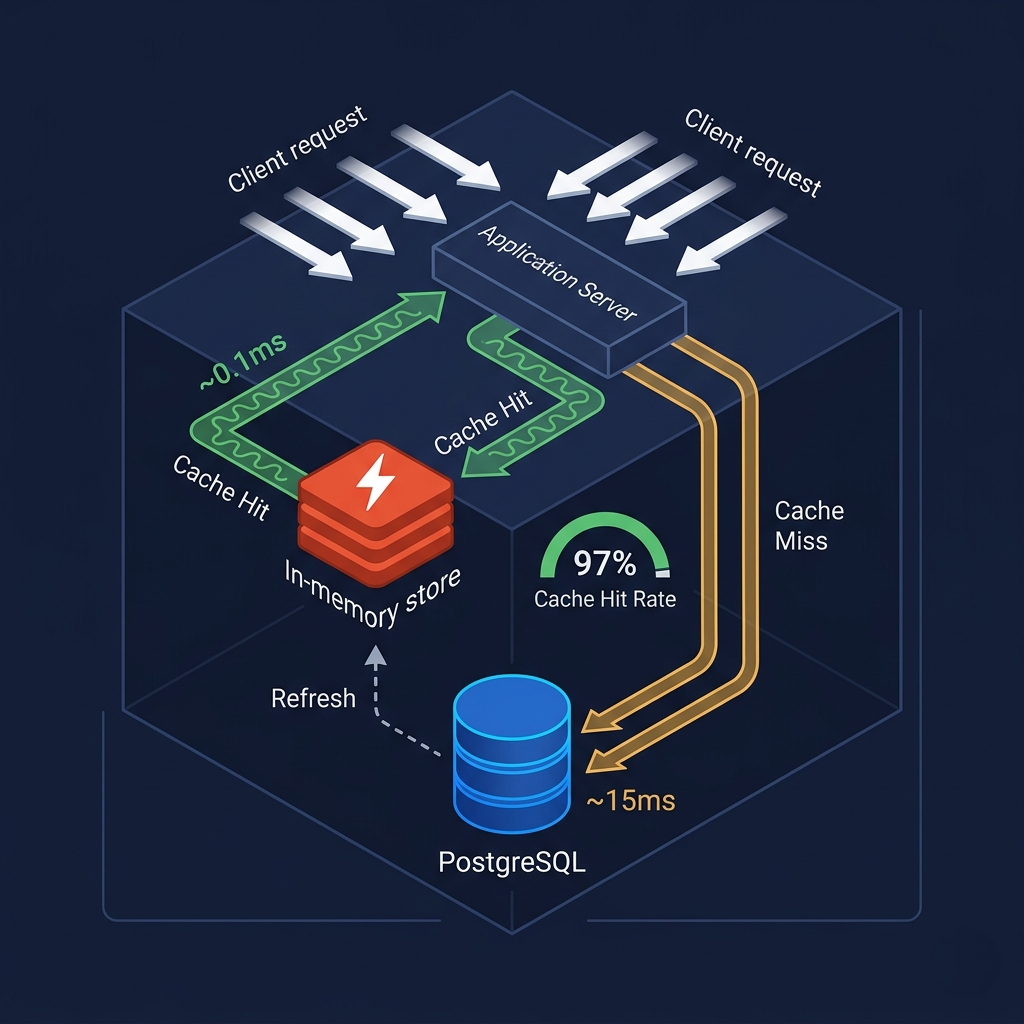
Caching is the fix. The concept is simple: the first time you compute or fetch something expensive, you store the result in a fast, in-memory store. Every subsequent request gets the cached result in microseconds instead of hitting the database. Redis and Memcached are the dominant tools — both are in-memory key-value stores capable of handling hundreds of thousands of operations per second with sub-millisecond latency.
The real craft of caching isn't setting it up — that's fifteen minutes of work. The craft is cache invalidation: knowing when the cached data is stale, and getting it out of the cache before users see it. It's not a coincidence that cache invalidation is famously listed as one of the two hardest problems in computer science. Get it wrong and users see outdated prices, stale inventory, or — worst of all — another user's data (if cache keys are misconfigured).
import redis
import json
import hashlib
from functools import wraps
from typing import Optional, Any

# Redis client setup
r = redis.Redis(host='localhost', port=6379, db=0, decode_responses=True)

# ---- Pattern 1: Cache-Aside (most common) ----
def get_product(product_id: int) -> dict:
    cache_key = f"product:{product_id}"

    # 1. Check cache first
    cached = r.get(cache_key)
    if cached:
        return json.loads(cached)  # Cache hit — ~0.1ms

    # 2. Cache miss — query database
    product = db.query("SELECT * FROM products WHERE id = %s", product_id)

    # 3. Store in cache with TTL (Time To Live)
    r.setex(cache_key, 3600, json.dumps(product))  # Expires in 1 hour

    return product  # Database hit — ~15ms

# ---- Pattern 2: Cache invalidation on write ----
def update_product_price(product_id: int, new_price: float):
    # Update database
    db.execute("UPDATE products SET price = %s WHERE id = %s",
               new_price, product_id)

    # Immediately invalidate the cache — force fresh read next time
    r.delete(f"product:{product_id}")

    # Also invalidate any listing caches that include this product
    r.delete(f"category_listing:{get_product_category(product_id)}")

# ---- Pattern 3: Cache stampede prevention ----
def get_trending_posts() -> list:
    cache_key = "trending:posts"
    lock_key = "lock:trending:posts"

    cached = r.get(cache_key)
    if cached:
        return json.loads(cached)

    # Use a distributed lock to prevent multiple processes from
    # simultaneously rebuilding the same expensive cache entry
    acquired = r.set(lock_key, "1", nx=True, ex=10)  # 10-second lock

    if acquired:
        try:
            posts = db.query("""
                SELECT p.*, COUNT(l.id) as likes
                FROM posts p
                LEFT JOIN likes l ON p.id = l.post_id
                WHERE p.created_at > NOW() - INTERVAL '24 hours'
                GROUP BY p.id
                ORDER BY likes DESC LIMIT 20
            """)
            r.setex(cache_key, 300, json.dumps(posts))  # Cache 5 minutes
            return posts
        finally:
            r.delete(lock_key)
    else:
        # Another process is rebuilding — wait briefly and retry
        import time
        time.sleep(0.1)
        return get_trending_posts()

# ---- Pattern 4: Cache warming (pre-populate on startup) ----
def warm_cache():
    """Pre-populate cache with frequently accessed data before traffic hits"""
    top_products = db.query("SELECT * FROM products ORDER BY view_count DESC LIMIT 1000")
    pipe = r.pipeline()  # Batch Redis commands for efficiency
    for product in top_products:
        pipe.setex(f"product:{product['id']}", 3600, json.dumps(product))
    pipe.execute()
    print(f"Cache warmed with {len(top_products)} products")
Here's the thing most caching tutorials miss: the cache hit rate is the metric that matters, and most teams don't measure it. A 90% hit rate sounds good until you realize that on 100,000 requests per second, 10,000 are still hitting the database — which may still be more than your database can handle. Aim for 95–99% hit rates on your hot data. Monitor it continuously. A drop in hit rate often signals a bug in cache invalidation logic before your monitoring catches the resulting database load spike.
💡 Pro Tips & Common Mistakes — Caching
Pro Tip: Use cache key namespacing and versioning:
v2:product:12345instead ofproduct:12345. When you change the structure of cached data (new fields, different format), increment the version prefix. This avoids serving old-format data from the cache after a deployment. Set different TTLs based on data volatility. Product descriptions: 24 hours. Product prices: 5 minutes. Inventory count: 30 seconds or no cache. Trending content: 5 minutes. Match the TTL to how much staleness is acceptable for that data type.
Common Mistake: Caching entire SQL result sets without considering cache key granularity. If you cache "all products in category X" and one product's price changes, you're invalidating a large cache entry that mostly didn't change. Cache individual entities (product:12345) and assemble them in the application layer.
Not accounting for the cold start problem. After a deployment or server restart, your cache is empty. If you have high traffic and a cold cache, every request hits the database simultaneously — potentially causing the very overload the cache was preventing. Implement cache warming.
7. Strategy 6: Replication — Making Copies That Actually Matter
By this point in your scaling journey, you've likely optimized queries, added caching, and maybe scaled your hardware. But there's a problem that no amount of query tuning fixes: a single database server is a single point of failure, and read-heavy workloads will eventually saturate even the best-optimized primary. Replication addresses both.
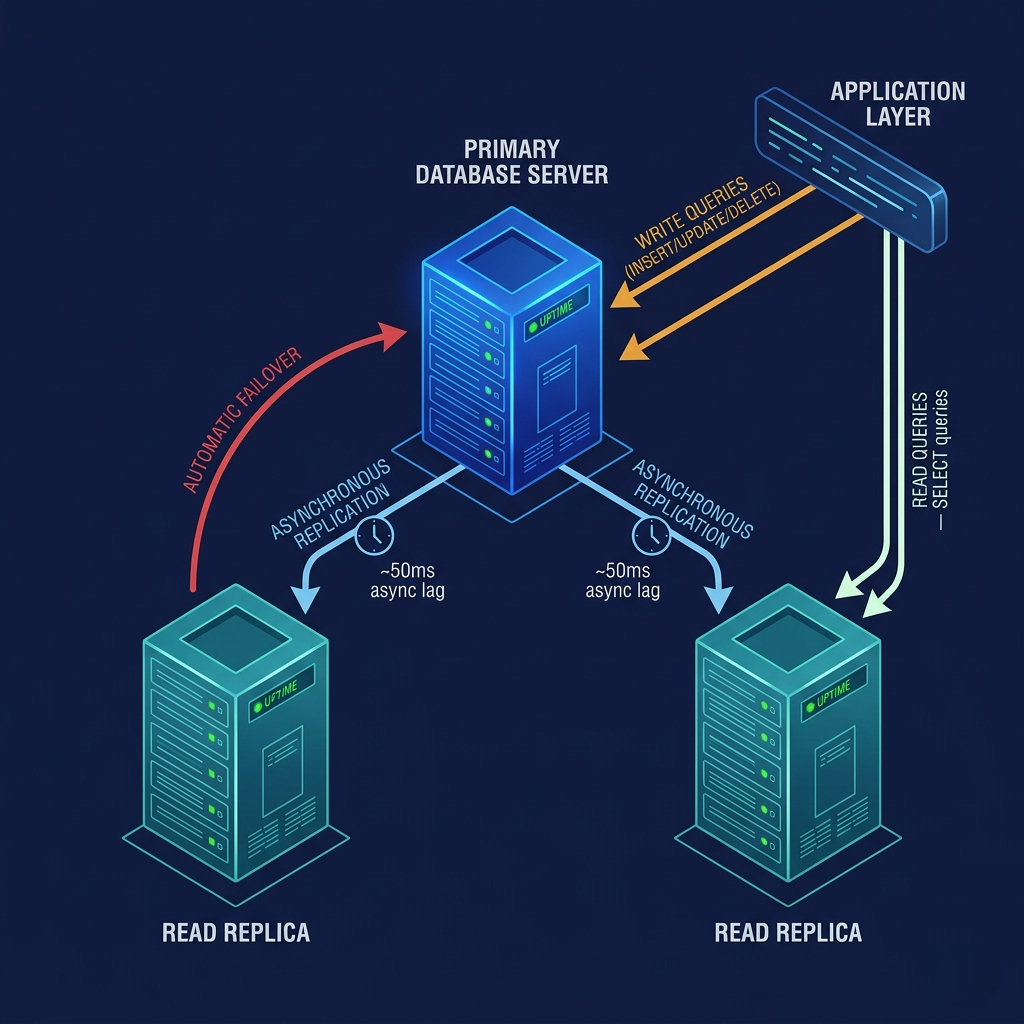
Replication creates one or more copies of your primary database — called replicas or read replicas — on separate servers. These replicas receive every write that hits the primary and apply it to their own copy of the data. The immediate benefit is high availability: if the primary fails, a replica can be promoted to primary, minimizing downtime. The performance benefit is read scaling: you can route read queries (SELECT) to replicas, freeing the primary to focus on writes (INSERT, UPDATE, DELETE).
The distinction between synchronous and asynchronous replication is where the real engineering trade-offs live. In synchronous replication, the primary waits for at least one replica to confirm it has written the data before acknowledging the write to the client. This guarantees zero data loss — if the primary fails immediately after a write, the replica has it. The cost is latency: every write now waits for a network round-trip to the replica. In asynchronous replication, the primary acknowledges the write immediately and replicates in the background. Write latency stays low, but there's a replication lag — replicas may be milliseconds or seconds behind the primary. A primary failure before the lag is resolved means some recent writes are lost.
# PostgreSQL streaming replication setup (simplified)

# --- On PRIMARY server ---
# postgresql.conf
echo "wal_level = replica
max_wal_senders = 3
wal_keep_size = 1GB
synchronous_commit = on          # on = sync, off = async
# For synchronous: name your standby
synchronous_standby_names = 'replica1'" >> /etc/postgresql/15/main/postgresql.conf

# pg_hba.conf — allow replica connection
echo "host replication replicator 10.0.0.2/32 scram-sha-256" >> /etc/postgresql/15/main/pg_hba.conf

# Create replication user
psql -c "CREATE USER replicator WITH REPLICATION PASSWORD 'strong_password';"

# --- On REPLICA server ---
# Take base backup from primary
pg_basebackup -h 10.0.0.1 -U replicator -D /var/lib/postgresql/15/main \
    -P -Xs -R  # -R creates standby.signal and recovery config automatically

# Start replica
systemctl start postgresql

# --- In application code: route reads to replica ---
# Using SQLAlchemy with read/write routing
from sqlalchemy import create_engine
from sqlalchemy.orm import sessionmaker

# Primary: all writes go here
primary_engine = create_engine(
    "postgresql://user:pass@primary-db:5432/mydb",
    pool_size=20,
    max_overflow=30
)

# Replica: reads only — can have multiple replicas and load-balance
replica_engine = create_engine(
    "postgresql://user:pass@replica-db:5432/mydb",
    pool_size=30,  # Replicas can handle more connections for reads
    max_overflow=50
)

ReadSession = sessionmaker(bind=replica_engine)
WriteSession = sessionmaker(bind=primary_engine)

# Usage — explicit routing by operation type
def get_user_profile(user_id):
    with ReadSession() as session:  # Hits replica
        return session.query(User).filter(User.id == user_id).first()

def update_user_email(user_id, new_email):
    with WriteSession() as session:  # Hits primary
        session.query(User).filter(User.id == user_id).update({"email": new_email})
        session.commit()

# Monitor replication lag
psql -h replica-db -c "SELECT now() - pg_last_xact_replay_timestamp() AS replication_lag;"
Here's a nuance that catches teams off guard: read-your-own-writes consistency. If a user updates their profile and you immediately redirect them to their profile page, the read goes to the replica — which might not yet have the write due to replication lag. The user sees their old profile. This looks like a bug. The solution is either routing reads to the primary for a short window after a write (sticky reads), using synchronous replication for critical writes, or reading from the primary for the specific user who just performed the write.
💡 Pro Tips & Common Mistakes — Replication
Pro Tip: Monitor replication lag continuously. A lag spike (replica falling behind) under heavy write load is a leading indicator of problems. If a primary fails during high lag, data loss occurs proportional to that lag. Alert on lag exceeding your RTO/RPO requirements. Use replicas for more than just production reads. Point your analytics queries, reporting jobs, and data exports at a dedicated replica. This completely isolates your heavy analytical workload from production traffic.
Common Mistake: Treating replicas as fully independent databases and running schema migrations on them directly. Always run migrations on the primary only — replicas apply DDL changes through replication. Running migrations independently on replicas causes replication to break. Not testing failover regularly. Replication setup that's never been tested in failure conditions is theoretical availability, not real availability. Run chaos engineering exercises — promote a replica, verify the application reconnects, measure the downtime. Do this before production forces it on you.
8. Strategy 7: Sharding — The Nuclear Option That's Sometimes Necessary
We've arrived at the most powerful and most complex strategy on this list. Sharding is not something you reach for early in a product's life — it's the strategy you implement when you've exhausted the others and your dataset has grown so large that no single database server, regardless of hardware, can handle it efficiently. It's the nuclear option. Powerful, with meaningful side effects.
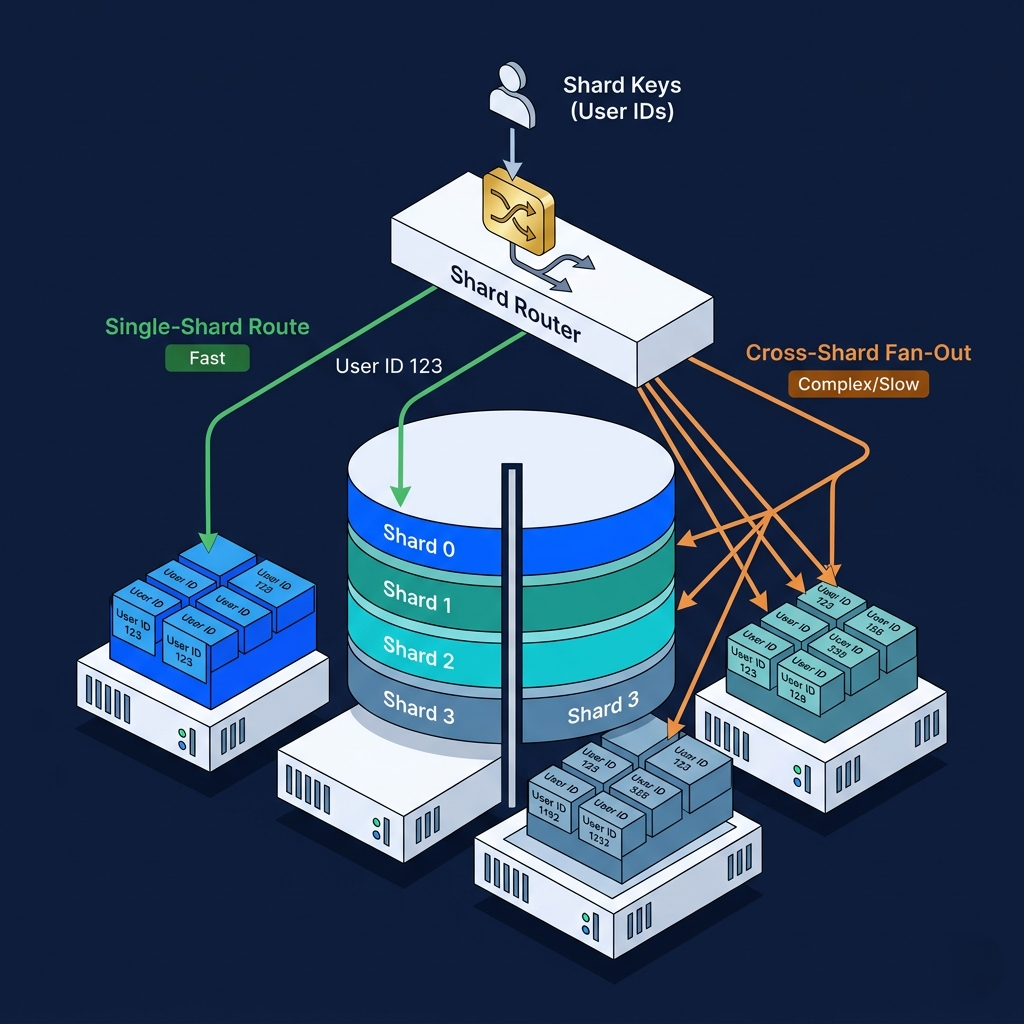
Sharding partitions your data horizontally across multiple independent database instances, called shards. Unlike replication — where every server has all the data — sharding means each server has only a subset of the data. A user with ID 1 might live on Shard A, while a user with ID 2 lives on Shard B. When the application needs user 1's data, it calculates which shard owns it and connects to that specific shard. No single shard bears the full weight of the dataset.
The sharding key — the attribute used to determine which shard owns a given row — is the most critical design decision in a sharded system. A poor sharding key creates hotspots: one shard getting dramatically more traffic than others. Imagine sharding by geographic region for a social network, and 60% of your users are in the US. Your US shard is a bottleneck; your other shards are idle. A good sharding key distributes data and load evenly — typically a high-cardinality attribute like user ID, with hash-based distribution to ensure randomness.
import hashlib
import psycopg2
from typing import Any

# Simple consistent hash-based sharding router
class ShardRouter:
    def __init__(self, shard_configs: list[dict]):
        self.shards = {
            i: psycopg2.connect(**config)
            for i, config in enumerate(shard_configs)
        }
        self.num_shards = len(shard_configs)

    def get_shard(self, shard_key: Any) -> psycopg2.connection:
        """Determine which shard owns this key"""
        # Hash the key to a consistent shard index
        key_hash = int(hashlib.md5(str(shard_key).encode()).hexdigest(), 16)
        shard_index = key_hash % self.num_shards
        return self.shards[shard_index]

    def execute_on_shard(self, shard_key: Any, query: str, params: tuple):
        conn = self.get_shard(shard_key)
        with conn.cursor() as cur:
            cur.execute(query, params)
            return cur.fetchall()

    def execute_all_shards(self, query: str, params: tuple = None):
        """Fan-out query across all shards — for cross-shard operations"""
        results = []
        for shard in self.shards.values():
            with shard.cursor() as cur:
                cur.execute(query, params)
                results.extend(cur.fetchall())
        return results

# Configuration — 4 shards across 4 database servers
router = ShardRouter([
    {"host": "shard-0.db.internal", "dbname": "appdb", "user": "app"},
    {"host": "shard-1.db.internal", "dbname": "appdb", "user": "app"},
    {"host": "shard-2.db.internal", "dbname": "appdb", "user": "app"},
    {"host": "shard-3.db.internal", "dbname": "appdb", "user": "app"},
])

# Single-shard query (fast — routes to exactly one shard)
def get_user(user_id: int) -> dict:
    results = router.execute_on_shard(
        shard_key=user_id,
        query="SELECT * FROM users WHERE id = %s",
        params=(user_id,)
    )
    return results[0] if results else None

# Cross-shard query (expensive — fans out to all shards and merges)
def get_top_users_globally(limit: int = 10) -> list:
    all_results = router.execute_all_shards(
        "SELECT id, username, follower_count FROM users ORDER BY follower_count DESC LIMIT %s",
        params=(limit,)
    )
    # Merge and re-sort results from all shards
    return sorted(all_results, key=lambda x: x[2], reverse=True)[:limit]
The cross-shard query in that last function reveals sharding's most painful trade-off: queries that span multiple shards require fan-out — sending the query to all shards, collecting all results, and merging them in the application layer. This is expensive, complex to paginate correctly, and loses the efficiency guarantees of a single-shard query. Database features like foreign keys, transactions, and joins that cross shard boundaries become architectural problems requiring careful workarounds or are abandoned entirely.
Re-sharding — redistributing data when your sharding scheme needs to change, or when shards become imbalanced — is one of the most painful operations in distributed systems. It requires carefully migrating data between shards while the system is live, without losing writes in transit. Companies like Instagram and Discord have published detailed engineering posts about the complexity of this operation. Don't add sharding until you genuinely need it. But when you do, there's no substitute.
💡 Pro Tips & Common Mistakes — Sharding
Pro Tip: Before implementing application-level sharding, evaluate managed horizontal scaling solutions: PlanetScale (MySQL-compatible), Citus (PostgreSQL extension for distributed tables), CockroachDB, or Vitess (which manages MySQL sharding for you). They handle much of the routing and resharding complexity transparently. Design your application to be "shard-aware" from the start if you anticipate needing it. Adding sharding after the fact requires rewriting query patterns throughout your entire application. Even if you start with one shard, building the routing layer early makes expansion far less painful.
Common Mistake: Choosing a sharding key that creates temporal hotspots. Sharding by
created_at(time-based sharding) means the current shard (this month's data) receives 100% of writes while all historical shards are idle. Always prefer hash-based distribution on a high-cardinality business key. Trying to maintain cross-shard foreign key constraints at the database level. The database can't enforce referential integrity across shard boundaries. Move this logic to the application layer with explicit validation, or design your data model to be shard-local — all related data for one entity lives on the same shard.
9. How It All Connects: A Decision Framework
These seven strategies aren't a menu where you pick one. They're a progression — a sequence of escalating interventions, each appropriate to a different stage of growth and a different type of bottleneck.
Start with indexing. It's free, it's fast to implement, and a missing index is responsible for a shocking proportion of database performance problems. Run EXPLAIN ANALYZE on your slowest queries. Add the right indexes. This alone often delivers a 10–100× improvement on specific query paths.
When you have complex analytical queries that are structurally slow (multiple joins, heavy aggregation, large data volumes), materialized views let you pre-compute and store results. Pair with a refresh schedule appropriate to your data freshness requirements.
If your read queries are fast but you have hot tables being joined repeatedly, denormalization of high-read, low-write data eliminates the join cost for your most critical paths. Apply surgically — not globally.
Vertical scaling is your next lever when your database's hardware is genuinely the ceiling. More RAM, faster storage, more CPU. It's fast to apply and buys meaningful headroom. Implement it in parallel with the logical optimizations above.
Caching removes entire categories of database queries for frequently-accessed, relatively stable data. A well-implemented cache can reduce database load by 70–90% on read-heavy workloads. Add Redis. Implement cache-aside. Measure your hit rate.
Replication solves two separate problems simultaneously: high availability (failover) and read scalability (distribute SELECT queries across replicas). Implement replication once you have traffic that justifies the operational overhead, or as soon as production data loss becomes unacceptable.
Sharding is the final frontier — reached only when your write volume or total data volume exceeds what a single primary database can handle, even after all the above. It's architecturally significant, complex to implement correctly, and difficult to undo. Apply it when the data demands it, not before.
The sequence matters. Every strategy you skip over when it was appropriate leaves complexity and cost on the table. Every strategy you implement before it's needed adds operational burden without proportional benefit.
10. Getting Started: A Practical Scaling Roadmap
Step 1: Establish your baseline
-- Find your slowest queries (PostgreSQL)
-- Enable pg_stat_statements extension first
CREATE EXTENSION IF NOT EXISTS pg_stat_statements;

SELECT
    round(mean_exec_time::numeric, 2) AS avg_ms,
    round(total_exec_time::numeric, 2) AS total_ms,
    calls,
    round((total_exec_time / sum(total_exec_time) OVER ()) * 100, 2) AS pct_total,
    left(query, 100) AS query_preview
FROM pg_stat_statements
ORDER BY total_exec_time DESC
LIMIT 20;
-- Attack the top 5 queries first — they account for most of your load
Step 2: Fix missing indexes
Run EXPLAIN ANALYZE on your top 5 slowest queries. Look for "Seq Scan" on large tables. Add appropriate indexes. Re-run EXPLAIN ANALYZE to confirm the planner uses them.
Step 3: Set up Redis caching for hot data
# Install Redis (Ubuntu)
sudo apt update && sudo apt install redis-server
sudo systemctl enable redis-server

# Install Python client
pip install redis

# Verify connection
redis-cli ping  # Returns: PONG

# Monitor cache hit rate in real time
redis-cli info stats | grep -E "keyspace_hits|keyspace_misses"
# Calculate: hits / (hits + misses) * 100 = hit rate %
Step 4: Add a read replica
For PostgreSQL on AWS RDS, this is a three-click operation in the console. For self-hosted, follow the replication setup in Strategy 6. Route your analytics and reporting queries to the replica immediately.
Step 5: Monitor and measure continuously
# Set up pgBadger for PostgreSQL slow query analysis
sudo apt install pgbadger
pgbadger /var/log/postgresql/postgresql-*.log -o report.html
# Open report.html — sorted by slowest queries, most-called queries, lock waits

# Key metrics to monitor (set up alerting for these):
# - Query p99 latency > 500ms → investigate
# - Cache hit ratio < 95% → investigate caching gaps
# - Replication lag > 1 second → investigate write load
# - Connection count > 80% of max_connections → add connection pooler (PgBouncer)
# - CPU > 70% sustained → consider vertical scale or caching improvements
Step 6: Evaluate sharding only when needed
If after all the above your primary database's write throughput or disk I/O is still saturated, evaluate managed horizontal scaling (PlanetScale, Citus, CockroachDB) before implementing application-level sharding. These solutions handle the routing complexity transparently.
11. FAQ
Q: What's the first database scaling strategy I should try?
Almost always: indexing. It's free, zero-risk to implement (using CREATE INDEX CONCURRENTLY), and a missing or misapplied index is responsible for the majority of database performance problems in applications that haven't had a serious query audit. Run EXPLAIN ANALYZE on your slowest queries, add the right indexes, and measure the improvement before doing anything else.
Q: Is caching always better than querying the database directly? Not always, and the failure mode matters. Caching adds complexity: you now have two systems to keep in sync, and cache invalidation bugs can cause users to see stale data. For data that changes frequently (shopping cart totals, live inventory, financial balances), caching is risky or impractical. For data that changes rarely (product descriptions, user avatars, category trees), caching is an obvious win. Evaluate data volatility before caching everything.
Q: What's the difference between database replication and database sharding? Replication creates copies of the entire dataset across multiple servers — every server has all the data. It improves availability and read scalability. Sharding partitions the dataset across servers — each server has only a portion of the data. It improves both read and write scalability, but at the cost of dramatically higher operational complexity. Use replication first; reach for sharding only when your total data volume or write rate exceeds single-server capacity.
Q: How do I choose the right sharding key? Choose a sharding key that: (1) distributes data evenly (high cardinality, random-ish distribution — user ID is ideal), (2) is almost always known at query time so you can route to a specific shard without fan-out, and (3) keeps related data co-located on the same shard. Most importantly, avoid time-based keys (created_at) which create write hotspots on the current time shard.
Q: When should I use vertical scaling vs. horizontal scaling? Vertical scaling (bigger hardware) first — it's simpler, lower risk, and often sufficient for longer than teams expect. Move to horizontal scaling (replication, sharding) when: vertical costs become prohibitive, you hit the maximum available instance size, you need write throughput beyond what one server provides, or you need fault tolerance that single-server vertical scaling can't provide. Don't horizontally scale prematurely — the operational complexity is real.
Q: What is cache stampede and how do I prevent it? Cache stampede (also called thundering herd) happens when a popular cache key expires and hundreds of requests simultaneously hit the database to rebuild it, potentially overwhelming it. Prevention strategies include: probabilistic early expiration (randomly regenerate the cache before it expires to avoid simultaneous expiration), mutex locking (only one process rebuilds; others wait), and cache warming (pre-populate before traffic arrives). The distributed lock pattern shown in the caching code section is the most robust approach.
Q: Can materialized views replace caching? They serve different purposes. Materialized views are database-level pre-computation — they reduce compute work within the database. Caching is application-level storage — it eliminates round-trips to the database entirely. Materialized views are best for complex analytical queries that are still database-bound. Caching is best for high-frequency reads of relatively simple, stable data. For maximum performance, combine both: use materialized views to pre-compute complex aggregates, then cache the results of reading those views.
Q: At what scale should I consider sharding? There's no universal threshold, but practical signals include: your primary database's CPU or I/O is consistently saturated after query optimization, caching, and vertical scaling; your dataset is approaching the reliable capacity of the largest available managed database instance (typically in the multi-TB range for transactional data); your write throughput exceeds ~50,000–100,000 writes per second; or query latency is dominated by lock contention that can't be resolved by other means. Most applications will never reach this point.
12. Conclusion
Database scaling isn't a single decision — it's a series of them, made in the right order, with clear understanding of what problem each strategy actually solves. The engineer who jumps straight to sharding because the app is slow is like a surgeon performing open-heart surgery when the patient just needed to drink more water. The engineer who refuses to scale beyond a single unindexed database server until it's on fire is the other mistake. The truth, as usual, is in the measured, sequenced middle.
Start with instrumentation — you can't optimize what you can't measure. Layer in indexing. Add caching. Scale the hardware. Replicate for availability and read scale. Denormalize the hot paths. And when the day comes that no single database can hold your data or absorb your write load, shard thoughtfully.
Your database is the foundation everything else depends on. Build it to last.